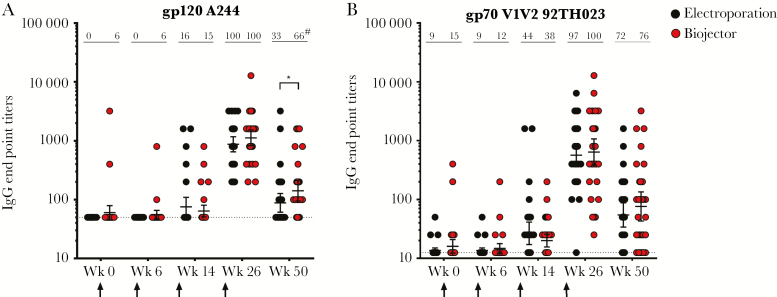
Figure 4.
Plasma binding antibody responses. Plasma binding antibody (bAb) titers were determined by enzyme-linked immunosorbent assay using gp120 (A244) (A) and gp70 (B) V1V2 scaffold (92TH023) CRF01_AE antigens. Samples were evaluated at weeks 0, 6, 14, 26, and 50 for both electroporation (black) and Biojector (red) groups. Responses are shown for vaccine recipients only; response rates as percentage of responses are depicted across the top of each column, with geometric mean titers and 95% confidence intervals indicated in the figure. Baseline values for each antigen are shown as a dotted line. Vaccination timepoints are indicated with an arrow. *P = .02 by 2-tailed Mann-Whitney test. #P = .01 by Fisher’s exact test. Abbreviation: IgG, immunoglobulin G.

