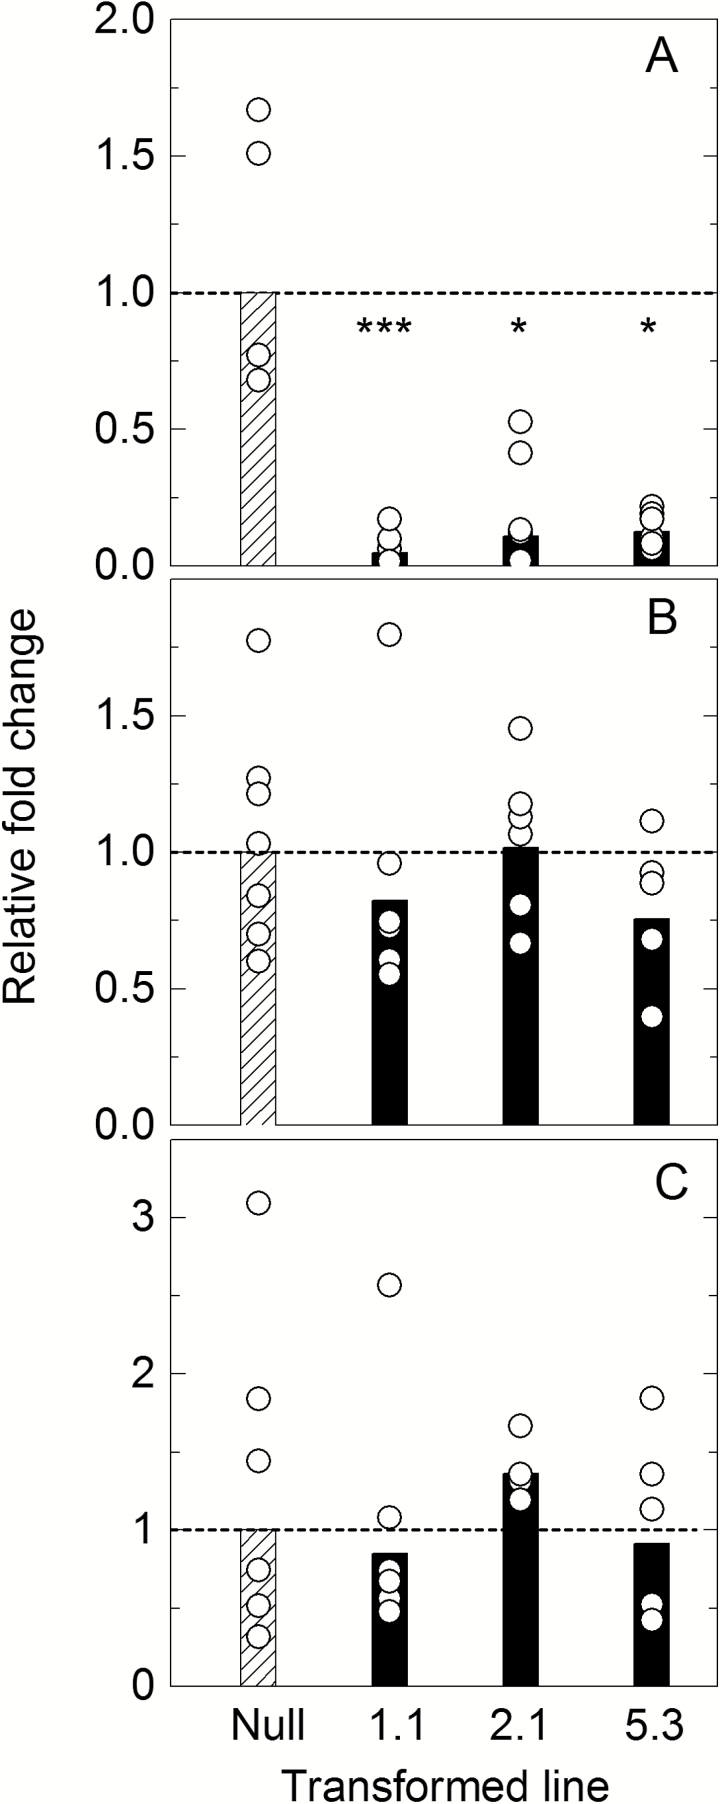
Fig. 1.
Expression level of β-CA transcripts. (A) Si003882m.g, (B) Si002140m.g, and (C) Si030616m.g in null control and CA transformed lines 1.1, 2.1, and 5.3 as measured by RT–qPCR and analysed by ΔΔCt. Fold change relative to the null transformant is shown; bars represent mean fold change, and circles show the data range of T2 plants (n=5–7 plants) from each transformation event measured in triplicate. The dotted line indicates average null fold change. Expression level of the major leaf β-CA transcript Si003882m.g (A) is significantly lower compared with the null control in all three transformed lines, calculated using one-way ANOVA.

