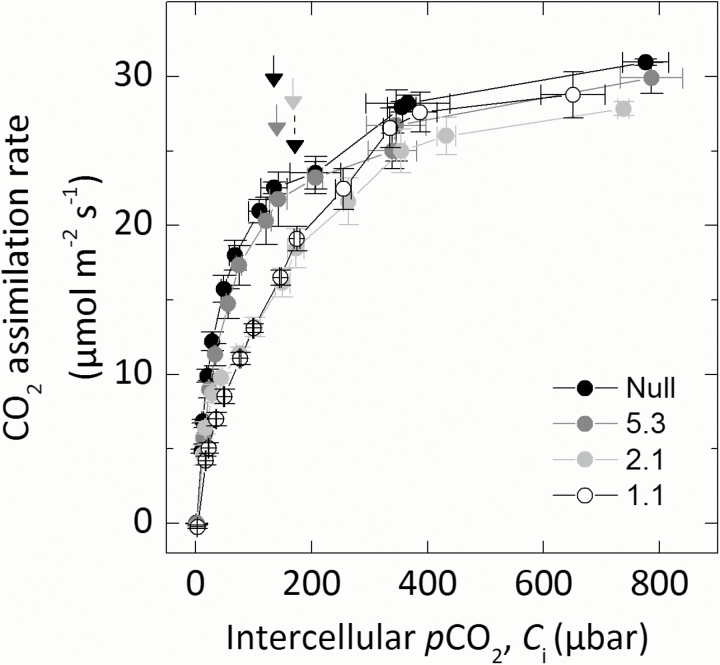
Fig. 3.
CO2 assimilation rate of transformed lines over a range of intercellular pCO2 (Ci). Average of three T2 plants from each line. Plants were grown at 2% CO2, and the uppermost, fully expanded leaves of 5-week-old plants were measured using a LI-6400XT at 25 °C leaf temperature at an irradiance of 1500 µmol photons m−2 s−1. Arrows mark ambient pCO2 for each line; note that the dotted arrow is line 1.1.

