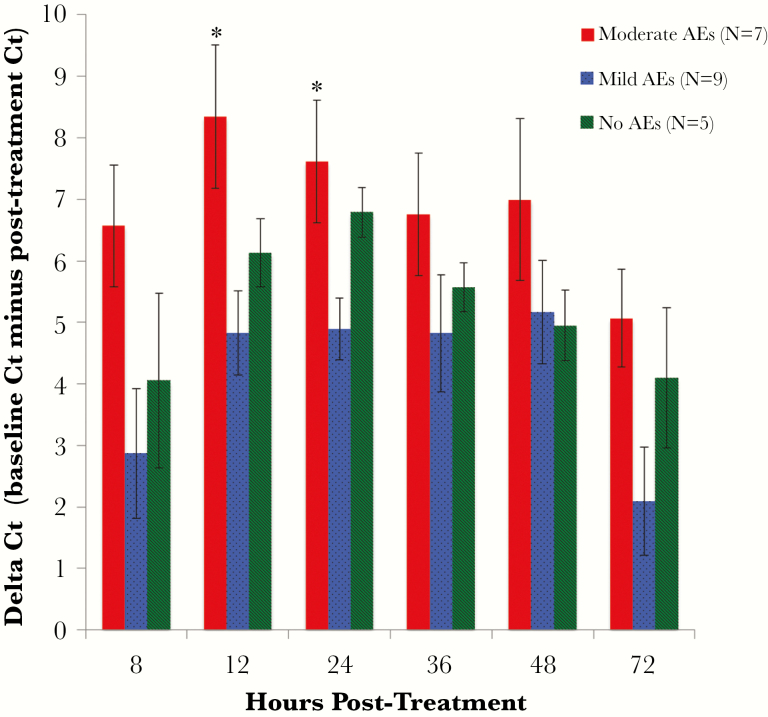
Figure 4.
Filarial DNA levels in plasma (expressed as ∆ cycle threshold [Ct] ± standard error) after treatment by adverse event (AE) group. Ct values decreased after treatment in all 3 AE groups, signifying an increase in filarial DNA levels in plasma. Mean ∆Ct values were significantly greater in the moderate AE group compared with the mild AE group at 12 (P = .025) and 24 (P = .020) hours posttreatment (by analysis of variance). *P < .05.

