Figure 2.

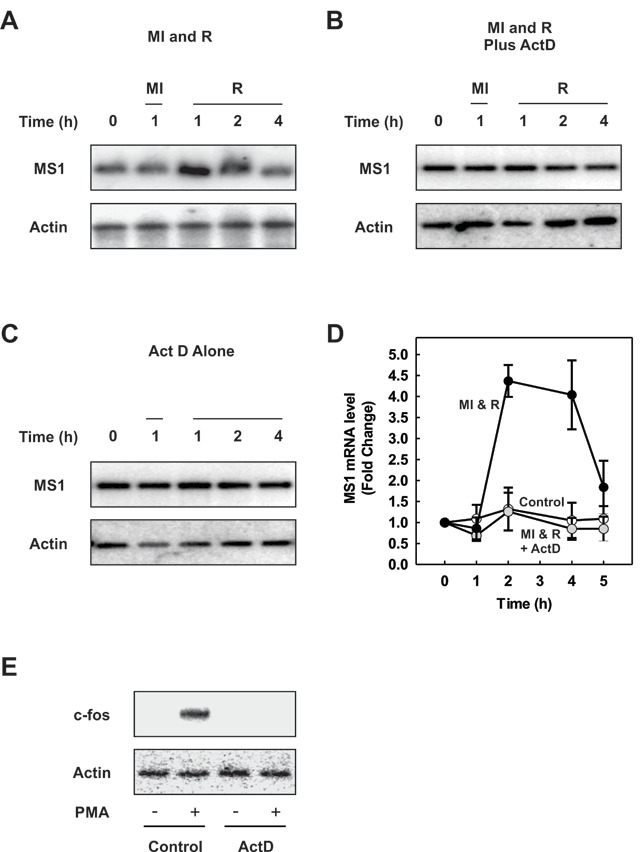
Increased levels of MS1 are due to transcription. (A) H9c2 cells were subjected to metabolic inhibition (MI) or allowed to recover (R) following 1h of metabolic inhibition for the times indicated. (B) H9c2 cells were preincubated with 5 µg/ml actinomycin-D for 1h then subjected to metabolic inhibition (MI) and recovery (R) in the continued presence of actinomycin-D, for the times indicated. (C) H9c2 cells were incubated in actinomycin-D for the times as indicated. MS1 and β-actin mRNA levels were determined by RT-PCR. (D) MS1 mRNA levels normalised to β-actin are presented graphically (mean ± SEM [n = 3]). (E) H9c2 cells were preincubated with or without 5 µg/ml actinomycin-D for 1h prior to treatment with 1 µM PMA for 30 minutes as indicated. Total RNA was isolated and c-fos and β-actin gene expression determined by RT-PCR.
