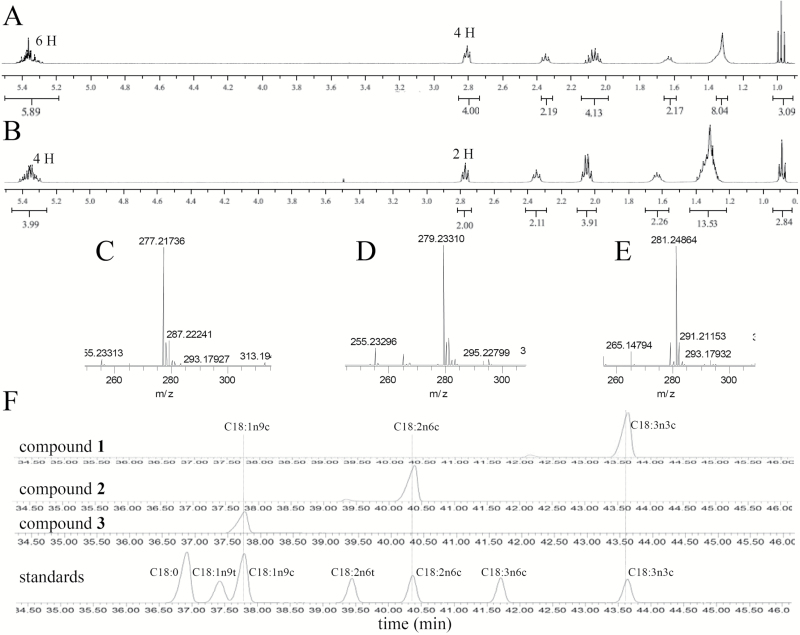
Fig. 2.
Structural elucidation of compounds in fractions 1, 2, and 3. (A) 1H-NMR spectrum of compound in fraction 1 (CDCl3, 400 MHz). (B) 1H-NMR spectrum of compound in fraction 2 (CDCl3, 400 MHz). (C) HRESIMS of compound in fraction 1 (ESI−). (D) HRESIMS of compound in fraction 2 (ESI−). (E) HRESIMS of compound in fraction 3 (ESI−). (F) Comparison of methyl derivatives of compounds in fractions 1, 2, and 3 with a standard fatty acid methyl ester mix.

