Fig. 2.
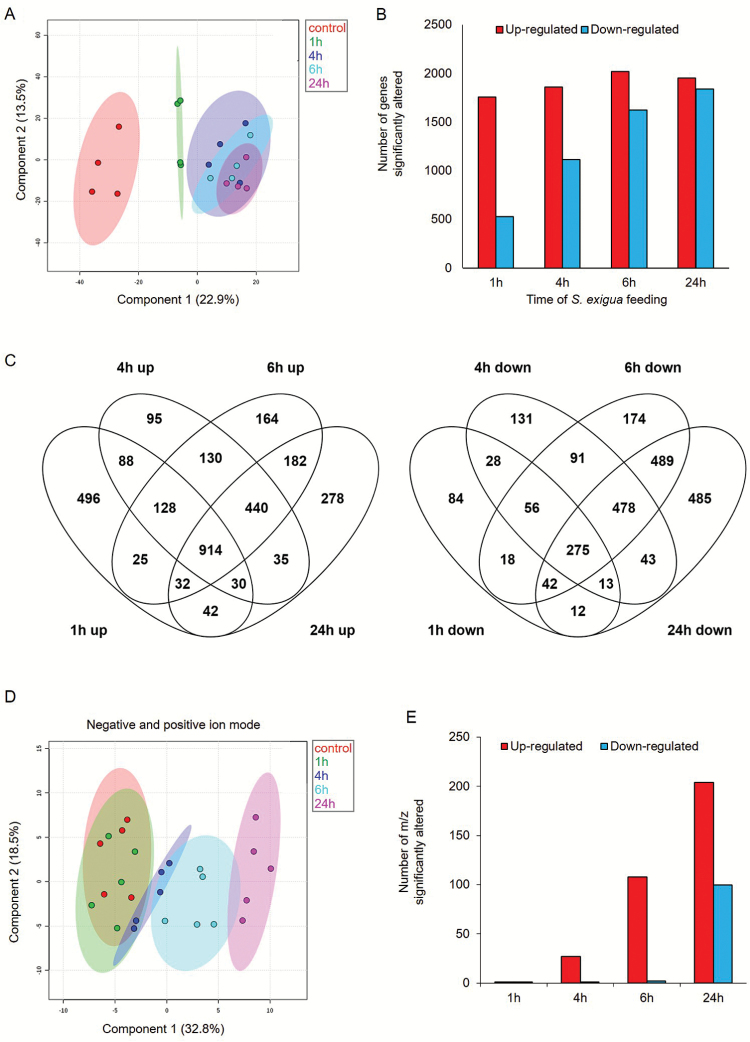
Transcriptomic and metabolomic overview of a time course of S. exigua feeding on maize inbred line B73 foliage. (A) PCA plot generated using 20 825 genes (FPKM>0 in at least 18 samples). Ovals indicate 95% confidence intervals. (B) Total number of transcripts that were significantly up- or down-regulated. (C) Venn diagram illustrating the number of genes up- or down-regulated by caterpillar infestation in the time course. P<0.05 FDR and fold change >2 or <0.5. (D, E) Untargeted metabolomics of maize leaf responses to caterpillar feeding. (D) PCA plot of negative (1024 electrospray ionization; ESI) and positive (1274 ESI) mass signals, filtered using Metaboanalyst software. Ovals indicate 95% confidence intervals. (E) Total number of mass signals that were significantly up- or down-regulated. (This figure is available in color at JXB online.)

