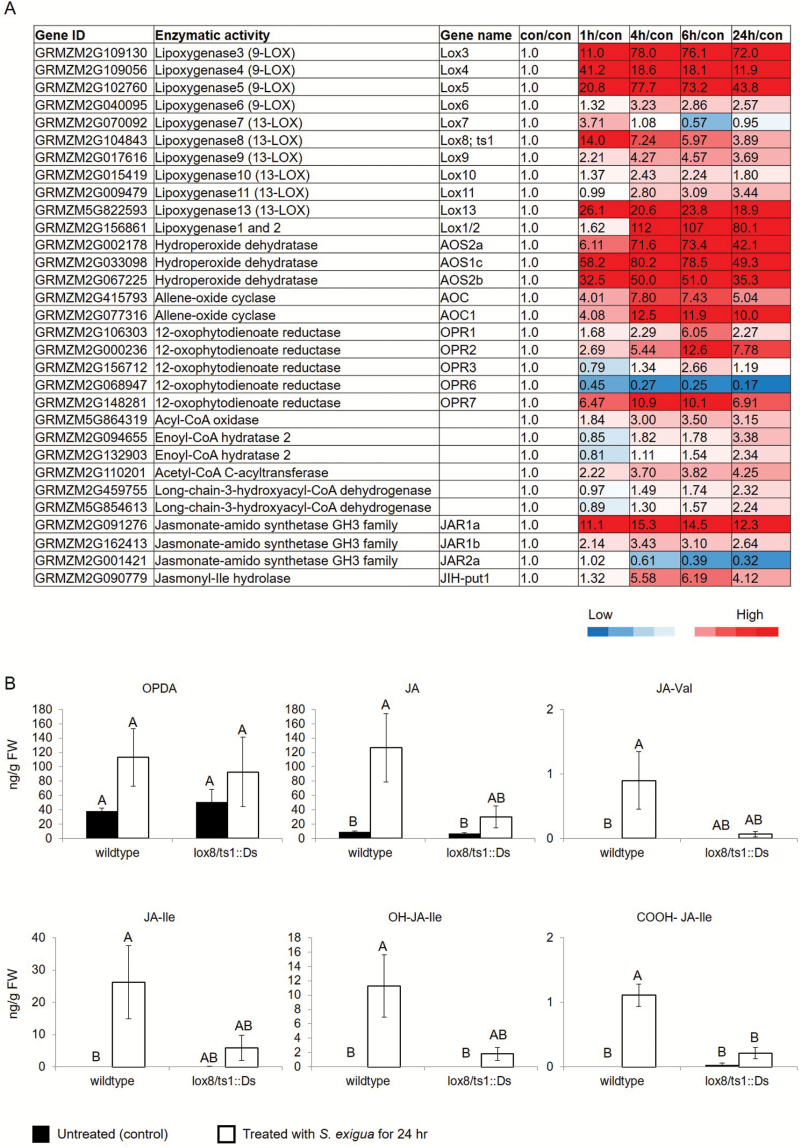
Fig. 5.
Effects of caterpillar feeding on jasmonic acid biosynthesis. (A) Heat map of gene expression that is related to jasmonic acid (JA) metabolism. Values are presented as fold change relative to untreated control samples. Mean±SE, n=4. (B) JA and JA conjugate levels in a lox8/ts1::Ds gene knockout line in response to caterpillar attack. Black bars, untreated; white bars, caterpillar infestation for 24 h. Different letters above the bars indicate significant differences, P<0.05, ANOVA followed by Tukey’s HSD test. (This figure is available in color at JXB online.)

