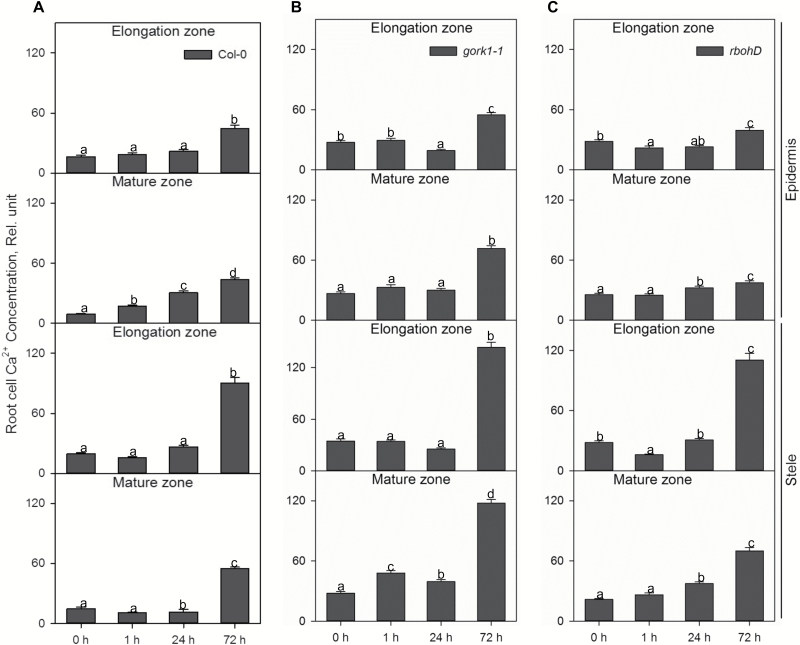
Fig. 5.
The time dependence of the relative Ca2+ concentration in the elongation and mature zone in the root epidermis and stele of Col-0 (A), gork1-1 (B), and rbohD (C) in response to hypoxia. The relative Ca2+ concentration was calculated by the fluorescence integrated density using Image J software. Data are the mean ±SE [n=180–270; 20–30 cells analysed for at least nine individual roots (biological replicates)]. Different lower case letters indicate a significant difference at P<0.05.

