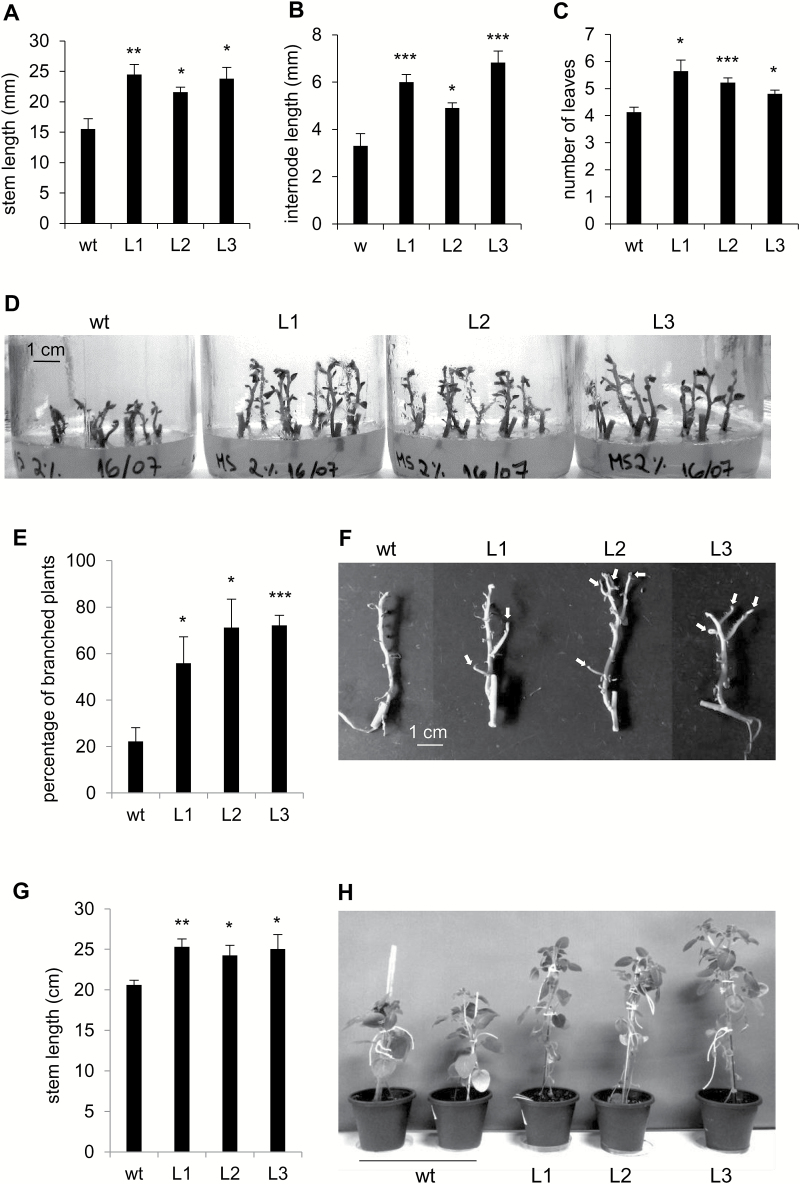
Fig. 11.
Phenotypic analysis of PHA1-OE plants grown in vitro. Wild-type (wt) and transgenic (L) plants generated from single-node cuttings were grown on MS medium plus 2% sucrose. After 2 weeks, the stem length (A), first internode length (B), and number of leaves (C) were determined. (D) Representative image of plants after 2 weeks of culture. (E) After 4 weeks, the percentage of branched plants was determined as the number of plants presenting at least one branch ≥5 mm, with respect to the total number of plants. (F) Representative image of wt and PHA1-OE plants grown in vitro for 4 weeks; leaves appear shrunken, since plants were allowed to air-dry for better visualization of branches, which are indicated with arrows. (G) Stem length of plants grown in soil, in a growth chamber, for 4 weeks after ex vitro transfer; a representative image of the plants is shown (H). Quantitative data of four independent experiments (mean ±SE) are displayed in the bar graphs; each experiment consisted of 15–20 in vitro cultured plants or 8–10 soil-grown plants per condition. The asterisks indicate statistical significance (*P<0.05, **P<0.01, ***P<0.005, with respect to the wt).

