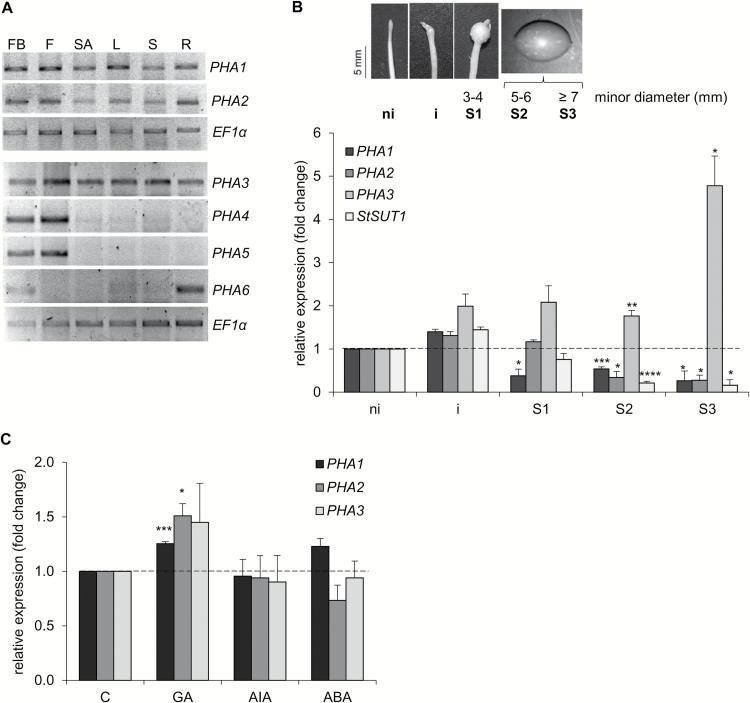
Fig. 2.
Expression profile of PHA genes. (A) Total RNA was isolated from different tissues of soil-grown potato plants, cDNA was synthesized, and semi-quantitative RT–PCR was performed. A representative RT–PCR analysis of three independent experiments is shown. FB, flower bud; F, flower; SA, shoot apex; L, leaf; S, stem; R, root. Quantitative data of RT–PCR bands are shown in Supplementary Fig. S2. (B) RT–qPCR analysis of PHA genes and StSUT1 during tuberization in vitro. Total RNA was obtained from stolons cultured under tuber-inducing conditions (MS medium plus 8% sucrose) at progressive stages of tuber development (ni, non-induced stolons; i, induced stolons with visible subapical swelling; S1–S3, tubers at different stages of growth). Quantitative data (mean ±SE) of three independent experiments, each consisting of four technical replicates, are displayed in the bar graph. The asterisks indicate statistical significance (*P<0.05, **P<0.01, ***P<0.005, ****P<0.001, with respect to non-induced stolons). (C) RT–qPCR analysis of PHA genes in stolons cultured under tuber-inducing conditions for 2 weeks, in the absence or presence of 5 μM GA3 (GA), 25 μM 3-indoleacetic acid (IAA), or 5 μM ABA. Quantitative data (mean ±SE) of three independent experiments, each consisting of four technical replicates, are displayed in the bar graph. The asterisks indicate statistical significance (*P<0.05, ***P<0.005, with respect to control, C).

