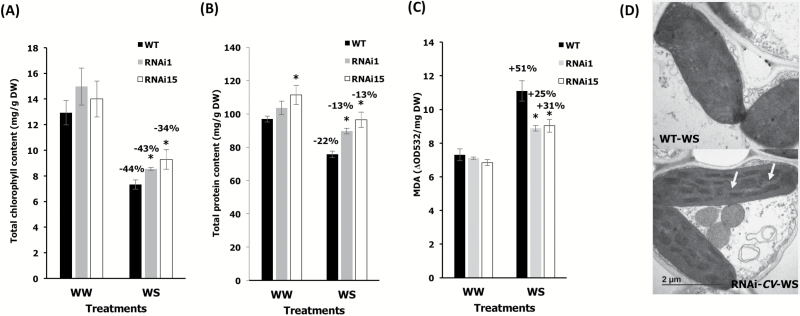
Fig. 3.
Effects of water stress on leaf stress parameters. (A) Total chlorophyll content, (B) total protein content, and (C) malondialdehyde (MDA) content of wild-type (WT) plants and silenced RNAiOsCV plants (RNAi1 and RNAi15). (D) Electron micrographs of chloroplasts from WT plants and the RNAiOsCV silenced plant line RNAi1 (RNAiOsCV) under water-deficit stress. Scale bars=2 μm. The arrows show well-organized grana thylakoids in RNAiOsCV. Values are the mean±SE (n=3–7 biological repetitions). The data were analyzed using Student’s t-test. Asterisks indicate significant differences from the WT for each treatment (P≤0.05). Percentages represent differences between control and stress conditions for each genotype.

