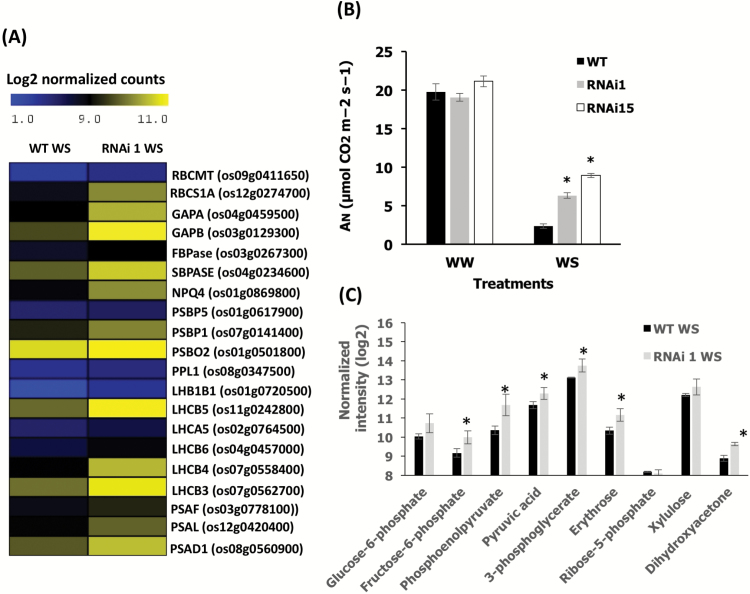
Fig. 5.
Effects of down-regulation of OsCV on photosynthesis. (A) A heatmap representation of selected photosynthesis-related genes (for full genes names, P-values, and expression values, see Supplementary Table S2) in wild-type (WT) and RNAiOsCV plants under water-deficit stress. (B) Analysis of carbon assimilation in flag leaves of WT and transgenic RNAiOsCV plants (lines RNAi1 and RNAi15). (C) Photosynthesis-associated metabolite contents from leaf tissue from WT and RNAiOsCV plants under water stress. Values are the mean±SE (n=3–8 biological repetitions). The data were analyzed using Student’s t-test. Asterisks indicate significant differences from the WT for each treatment (P≤0.05 except for F6pho P<0.06, pyruvic acid P<0.09, and 3PGA P<0.1).

