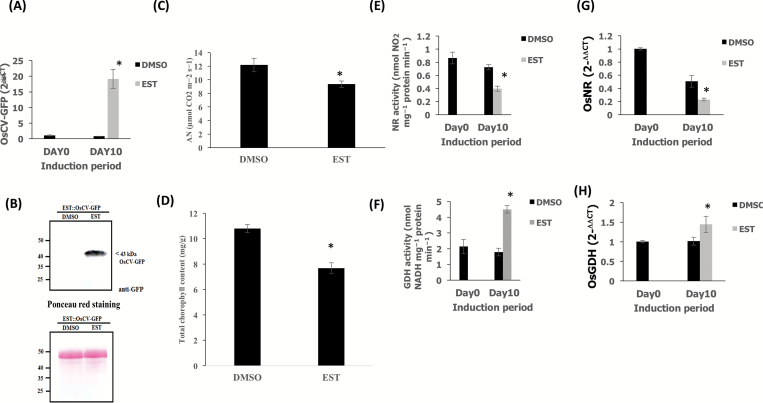
Fig. 7.
Overexpression of OsCV alters N metabolism. (A) Quantitative RT-PCR analysis of OsCV gene expression in the DMSO- and estrogen-treated plants transformed with EST::OsCV-GFP. (B) Immunoblot analysis of estrogen-induced OsCV–GFP expression using an anti-GFP antibody in DMSO (solvent control)- and estrogen-treated EST::OsCV-GFP plants. Ponceau S staining indicated the equal loading of total protein extractions for immunoblot analysis. (C) Analysis of carbon assimilation. (D) Total chlorophyll content (E), activity, and (G) expression of nitrate reductase in DMSO- and estrogen-treated EST::OsCV-GFP plants. (F) Activity (deamination) and (H) expression of glutamate dehydrogenase in DMSO- and estrogen-treated EST::OsCV-GFP. Values are the mean±SE (n=3–4 biological repetition). The data were analyzed using Student’s t-test. Asterisks indicate significant differences from DMSO-treated plant for each treatment (P≤0.05).

