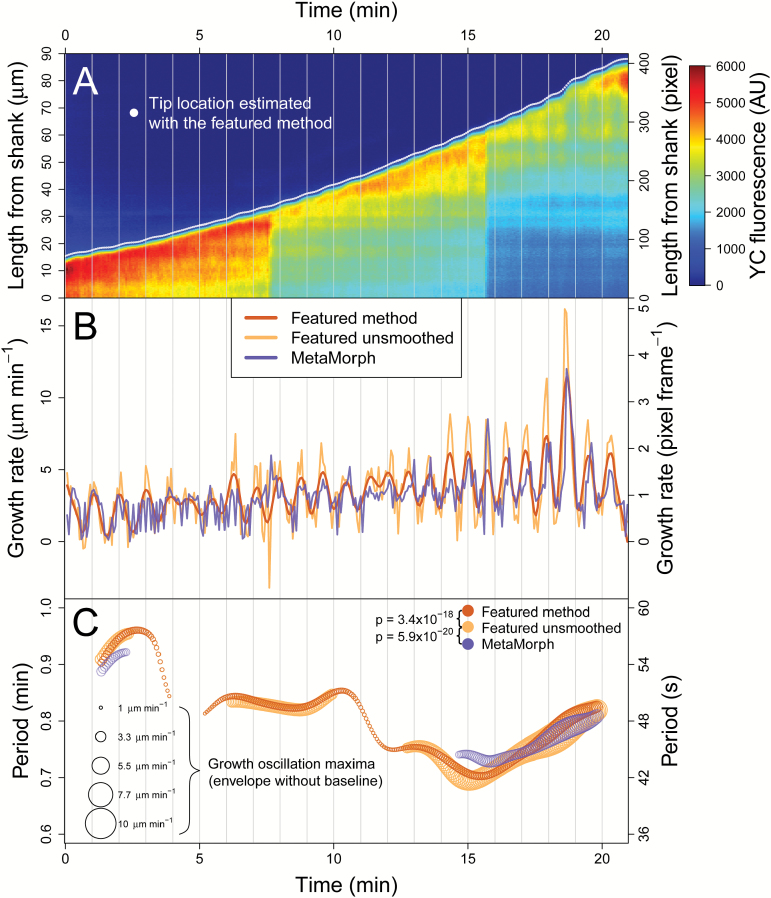
Fig. 5.
Comparing the detection of periodic components. (A) Oscillatory single channel kymograph with tip location detected by CHUKNORRIS (featured method). (B) Growth rate series estimated by MetaMorph or CHUKNORRIS (featured method) smoothed or not. (C) Period of oscillations detected in the series above by the different methods, with the diameter of the circles being proportional to the amplitude of the growth oscillation detected (envelope without the baseline/trend). Periodic components of the detrended time series in C obtained with a continuous wavelet transform. The smooth version of CHUKNORRIS clearly outperforms the other alternatives. Significant differences in detecting oscillations were accessed with a paired proportion test (McNemar’s) on 2 × 2 contingency tables.

