Fig. 8.
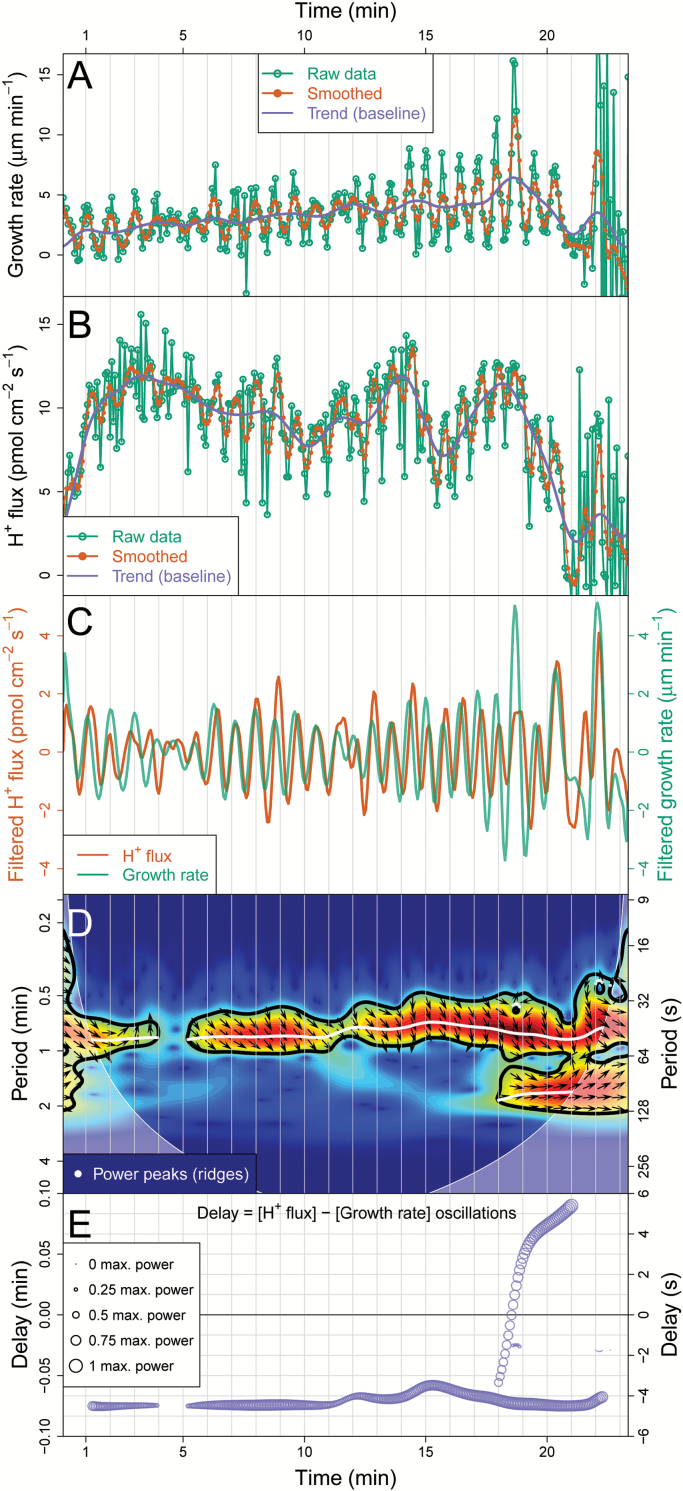
Synchronization analysis module. (A) Growth rate series extracted from a single channel kymograph with the corresponding smoothing and extracted trend. (B) Extracellular H+ fluxes at the tip (influx) measured concomitantly with the series in A, with its corresponding smoothing and extracted trend. (C) Matched and filtered series (using a discrete wavelet transform). (D) Cross wavelet transform showing regions of significant joint periodicity with arrows indicating the phase relationship. The arrows point to the direction of the trigonometric circle corresponding to the local phase angle between two series (e.g. x and y), both being in phase if arrows point to the right, in anti-phase if pointing to the left, x precedes y if pointing up, while y precedes x if pointing down (further information in the main text under “Synchronization module”). Colours correspond to the power of specific components through time (time-frequency space) with significant (P < 0.05) periods circled in black. White dots indicate the peaks of the power spectrum detected (wavelet ridges), while the shaded regions correspond to the ‘cone of influence’, a region in which analysis is not reliable. (E) Time delay estimated with the cross wavelet analysis between extracellular H+ flux and growth rate oscillations, showing that growth leads (occur before) by a small delay for most of the series, until a long-period component appears (seen in D) introducing another delay. The size of the circles shows the relative oscillation amplitude (normalized by maximum power).

