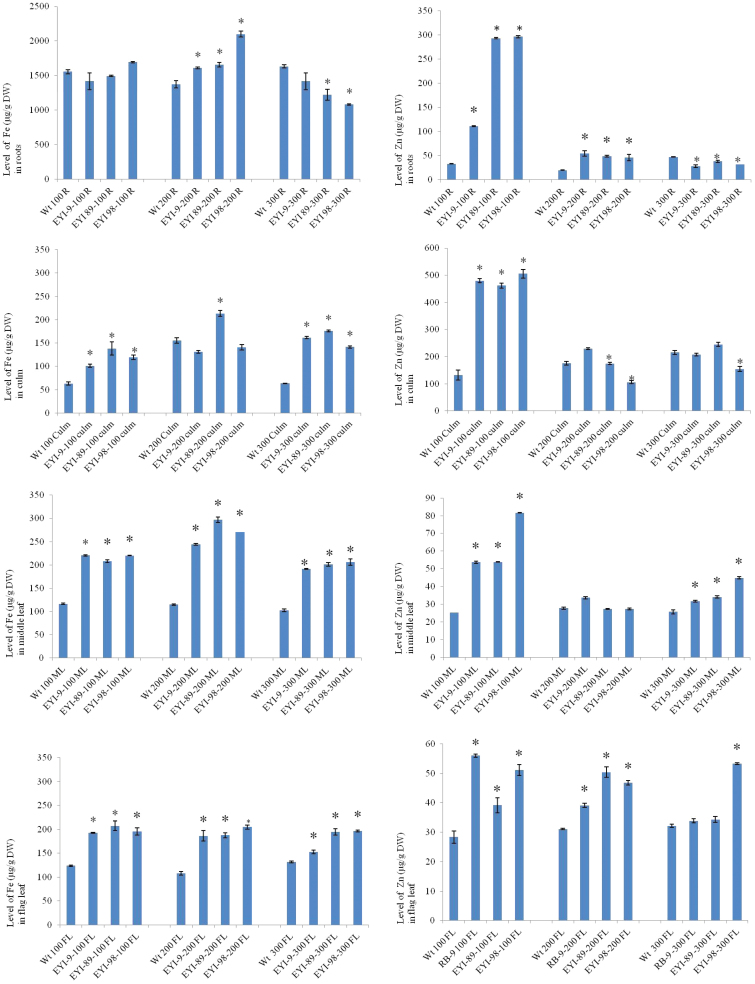
Fig. 4.
Fe and Zn levels (µg g−1 DW) in the roots, culm, middle leaf, and flag leaf of wild-type (WT) rice and three different T2 transgenic lines co-expressing OsNAS1 and HvNAATb (EYI-9, EYI-89, and EYI-98) under 100 (control), 200, and 300 µM Fe treatments. DW, dry weight; FL, flag leaf; ML, middle leaf; R, roots. Asterisks indicate statistically significant differences between wild-type and transgenic plants under the same Fe feeding regime as determined by Student’s t-test (P<0.05; n=3). In both the wild-type and transgenic lines, the samples of roots, culm, middle leaf, and flag leaf were harvested at physiological maturity. (This figure is available in color at JXB online.)

