Fig. 2.
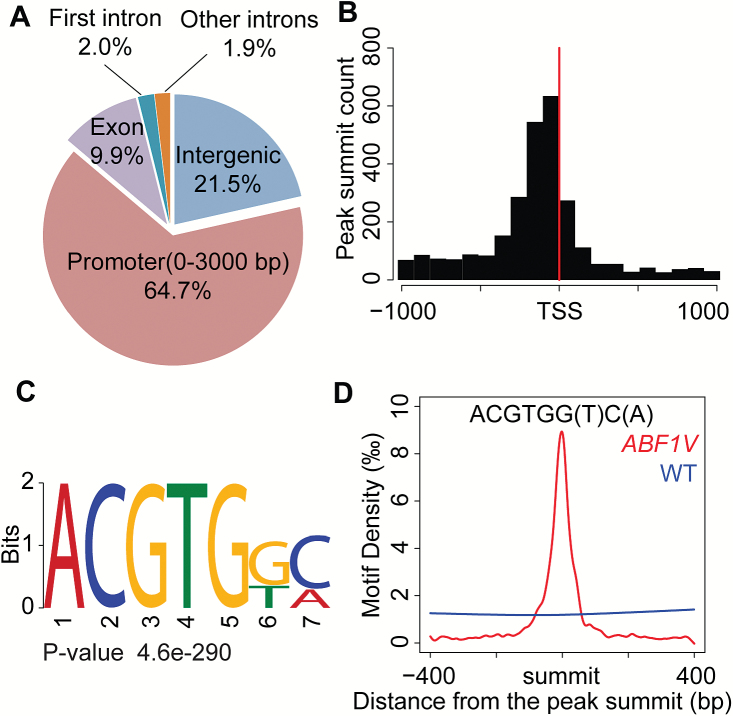
Identification of the ABF1V binding sites by analysis of the ChIP-seq data. (A) Overview of ABF1V binding peak distribution in the rice genome. (B) Enrichment of ABF1V binding peaks in the promoter region. TSS, transcriptional start site. (C) Consensus sequence identified in the ABF1V binding peaks by the MEME-ChIP program. (D) Density plot of the ACGTG(G/T)(C/A) motif around the summits of overlapping peaks in the ChIP-seq data of the ABF1V line drawn by the R program. The density curve of WT ChIP-seq data was used as a negative control.

