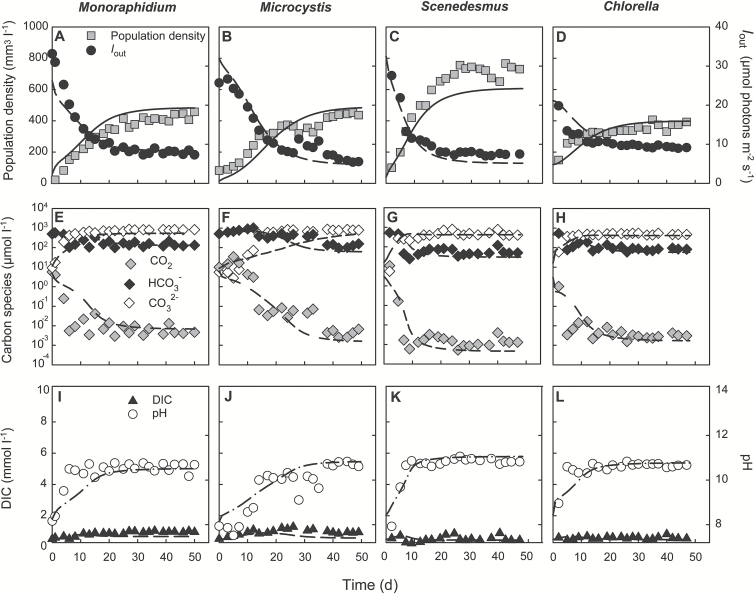
Fig. 1.
Monoculture experiments at low pCO2 (100 ppm). (A–D) Population density (expressed as biovolume) and light intensity Iout penetrating through the chemostat. (E–H) CO2(aq), bicarbonate and carbonate concentrations. (I–L) Dissolved inorganic carbon (DIC) and pH. Different panels represent different species: (A, E, I) Monoraphidium; (B, F, J) Microcystis; (C, G, K) Scenedesmus; (D, H, L) Chlorella. Symbols indicate experimental data, and lines indicate model fits. Parameter values of the model are provided in Table 1 and Table 2.

