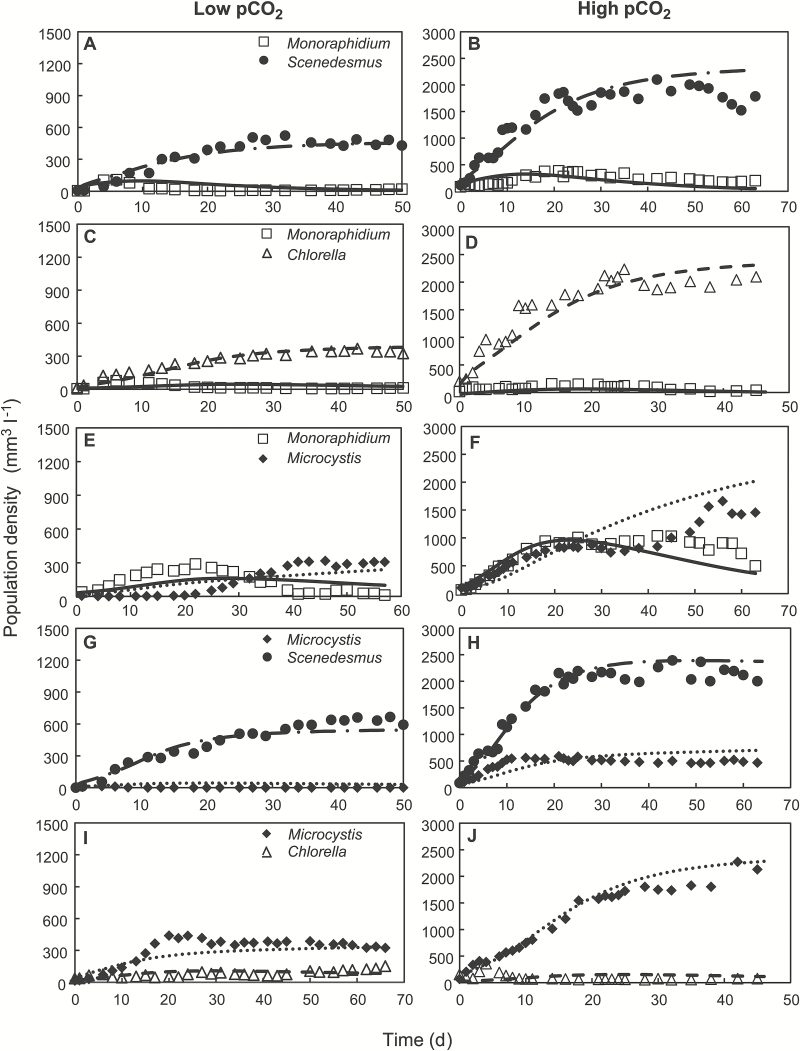
Fig. 4.
Competition experiments. The competition experiments were performed at low pCO2 (100 ppm; left panels) and high pCO2 (2000 ppm; right panels). (A, B) Competition between Monoraphidium and Scenedesmus. (C, D) Competition between Monoraphidium and Chlorella. (E, F) Competition between Monoraphidium and Microcystis. (G, H) Competition between Microcystis and Scenedesmus. (I, J) Competition between Microcystis and Chlorella. Dynamic changes in light conditions, carbon speciation and pH during the competition experiments are presented in Supplementary Figs S1 and S2. Symbols indicate experimental data, and lines indicate model predictions. Parameter values of the model are provided in Tables 1 and 2.

