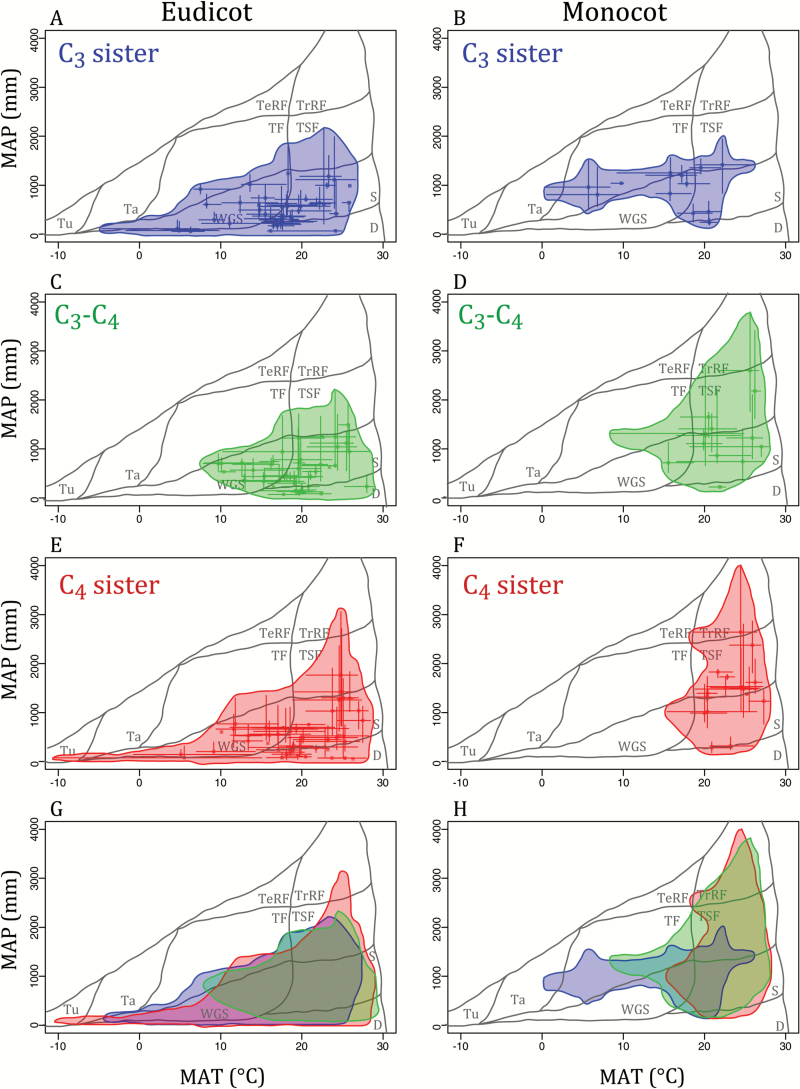
Fig. 2.
Comparative C3–C4 distributions across biomes. The median ± 10th and 90th quantiles for mean annual temperature (MAT) and precipitation (MAP) are plotted for eudicot (left) and monocot (right) C3 sister (blue; A, B), C3–C4 (green, C, D), and C4 sister (red, E, F) taxa. The bottom row overlaps the three distributions for eudicots (left, G) and monocots (right, H). All panels contain biome classifications (see Ricklefs, 2008) for tropical rainforest (TrRF), temperate rainforest (TeRF), temperate forest (TF), tropical seasonal forest (TSF), woodland/grassland/shrubland (WGS), savanna (S), desert (D), taiga (Ta), and tundra (Tu).

