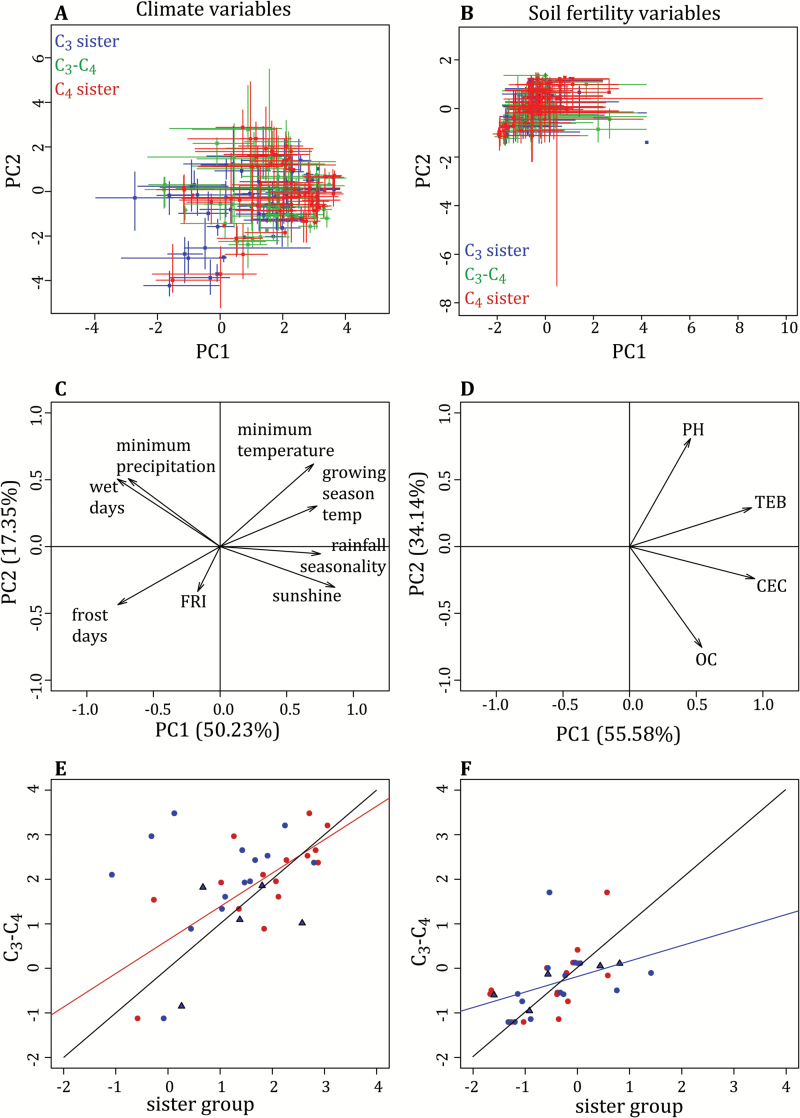
Fig. 3.
Distribution of photosynthetic types in ecological space. The median ± 10th and 90th quantiles for the first two principal component axes (PC1 and PC2) of the climate (A) and soil fertility (B) PCAs for C3 sister (blue), C3–C4 (green), and C4 sister (red) taxa. The associated variable factor maps for the climate and soil fertility PCAs are shown in (C, D). Shifts in the primary axis of the climatic (E) and soil fertility (F) PCAs, as comparisons between C3–C4 taxa and their closely related C3 (blue) and C4 (red) sister taxa within each phylogenetic group. Comparisons of C3–C4 taxa and their C3 relatives in groups that lack close C4 relatives are presented as blue triangles. Black lines indicate the 1:1 relationship. Linear relationships are shown for correlations significant after correction for multiple testing (P<0.00625), in the relevant color (see Table 3).

