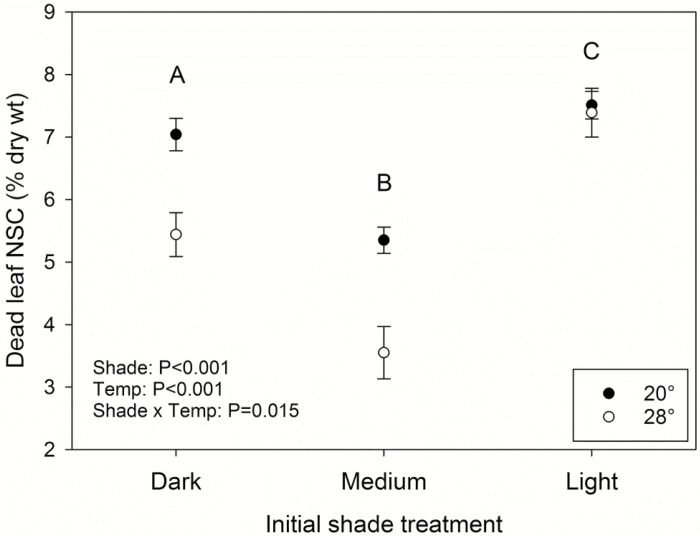
Fig. 6.
Non-structural carbohydrate (NSC) concentrations of dead leaves. Different letters represent significantly different values between the initial, pre-darkness shade treatments according to Tukey’s HSD, and error bars represent SE. Closed and open symbols represent seedlings from the 20 and 28 °C darkness treatments, respectively. Dead leaf tissue was collected at leaf area half dead, leaves all dead (LAD), and post-LAD (data were combined as there was no effect of stage on dead leaf NSC; P=0.55). n=14, 17, and 30 for dark-, medium-, and light-shade treatments, respectively.

