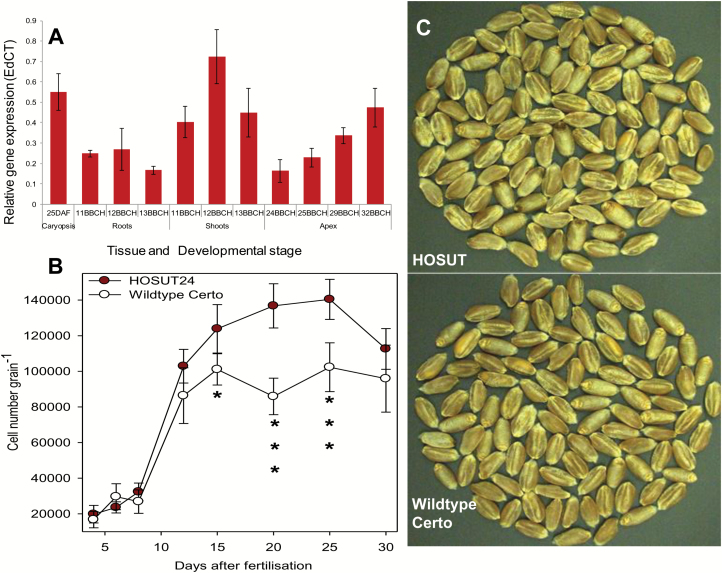
Fig. 2.
(A) HvSUT1 transgene expression in different tissues of the HOSUT line on the basis of quantitative real-time PCR. Development was recorded using the BBCH scale, BBCH 11, 12, 13, one-, two-, and three-leaf stage, respectively; BBCH 24, 25, tillering stage; 29, end of tillering; 32, node 2 at least 2 cm above node 1. (B) Endosperm cell number per grain for HOSUT24 and Certo. Data are means ±SD, n=6, significant differences according to t-test, *P<0.05, ***P<0.001. (C) Mature grains of HOSUT and Certo. (This figure is available in colour at JXB online.)

