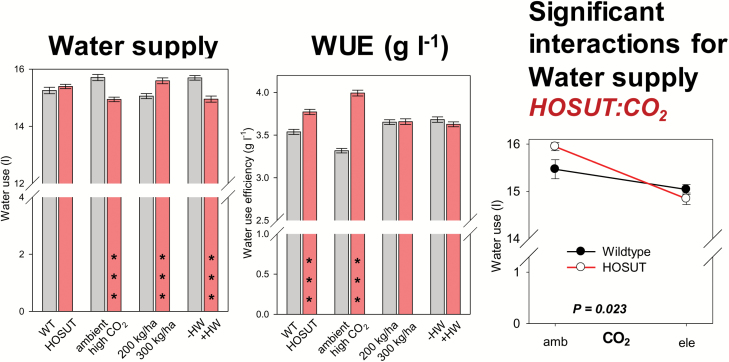
Fig. 5.
Bar charts: the factors line, CO2, N fertilization, and heat wave influencing water supply and water use efficiency (WUE). Bars represent the mean across all other treatments and are means ±SE n=48, significant differences according to four-way ANOVA, ***P<0.001. Line plot: significant interaction between the factors line:CO2 and line:N fertilization. Data points are means ±SE, n=24. (This figure is available in colour at JXB online.)

