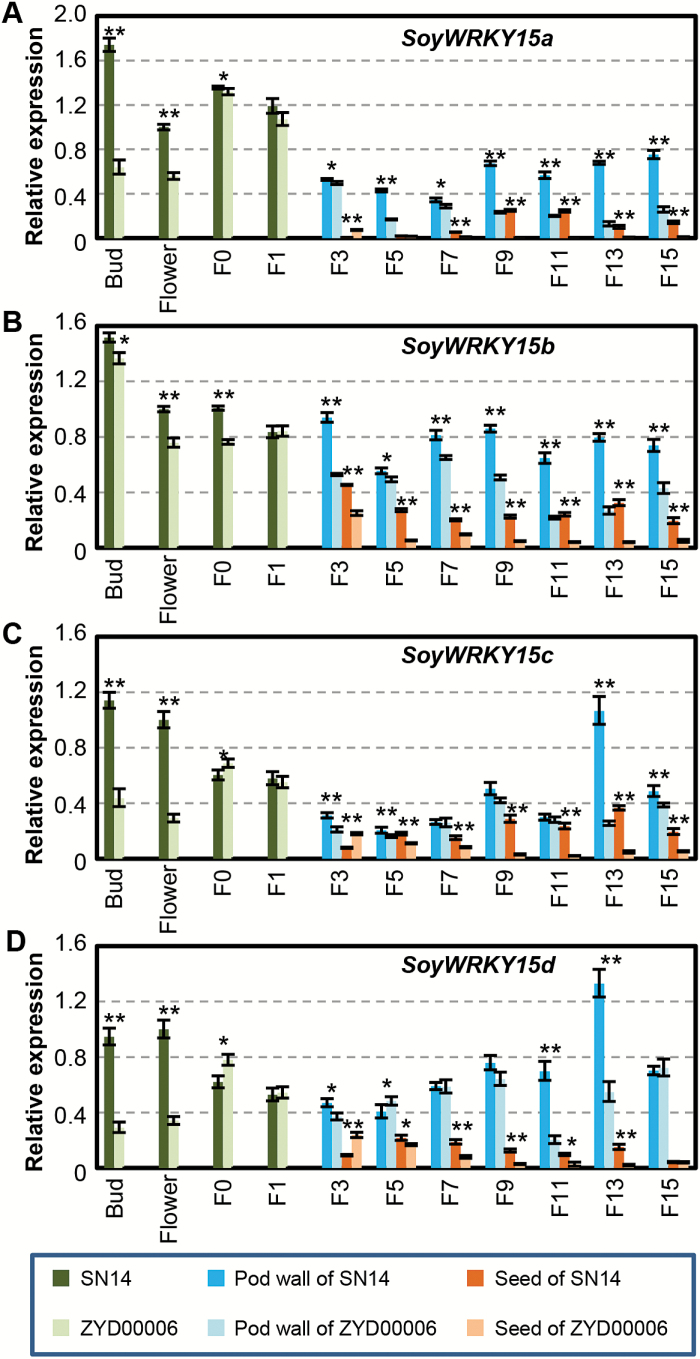
Fig. 3.
Expression of SoyWRKY15 genes during fruit development. (A) SoyWRKY15a. (B) SoyWRKY15b. (C) SoyWRKY15c. (D) SoyWRKY15d. The tissues are unfertilized flower buds, flowers, and developing pods as indicated. The pods were divided into pod walls and seeds after the F3 stage. Actin (Glyma18g52780) is used as the internal control in qRT–PCR. The average relative expression and the SD are presented (n=3). The column legends of each graph are the same and are given underneath. Asterisks indicate significance using Student’s t-test (*P<0.05; **P<0.01) when gene expression in SN14 was compared with that in ZYD00006.

