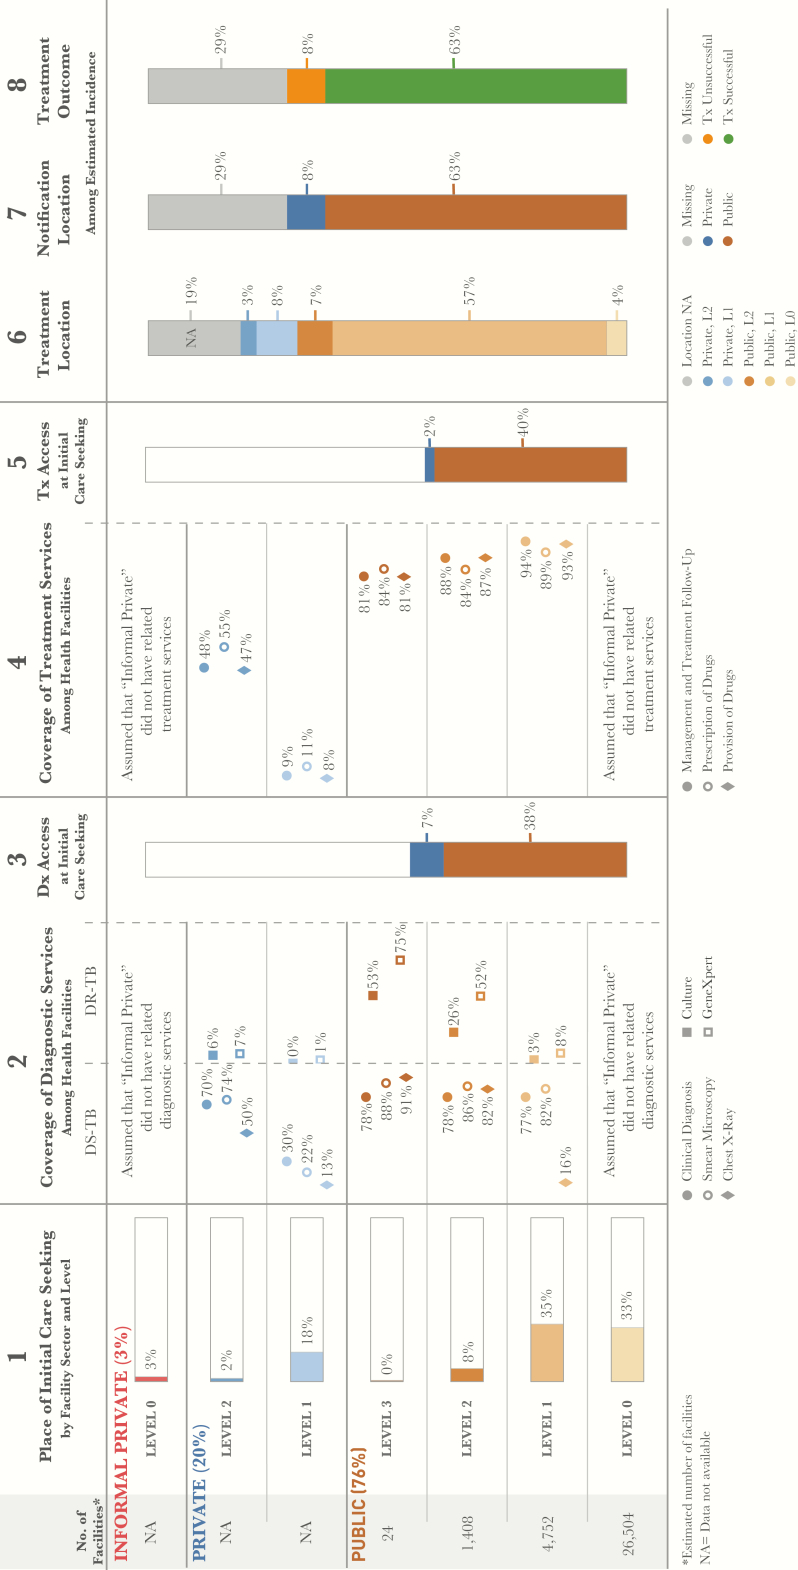
Figure 1.
Patient-pathway visual at the national level. The patient pathway describes the care-seeking patterns of patients and how those patients may intersect with tuberculosis services. Column 1 starts by showing the sectors and levels of the health system (sectors and levels where no data was available are not included in the pathway). The percentage next to each sector title is the share of patients who initiate care seeking in this sector [2]. Next is the estimated number of health facilities at each level within each sector. There are no data available for the number of health facilities in the private sector (formal or informal). The public-sector numbers are estimated using guidelines for the number of patients each type of facility is intended to cover [2]. The final part of column 1 depicts the percentage of patients seeking initial care, by level [2]. Column 2 shows the estimated percentage of health facilities that have tuberculosis diagnostic tools at each sector and level of the health system [10]. Diagnostic tools are separated by tools for diagnosing drug-susceptible tuberculosis and those diagnosing drug-resistant tuberculosis. Column 3 shows the estimated percentage of patients likely to access a facility with tuberculosis diagnostic tools available on their initial visit to a healthcare facility. Access to diagnosis was calculated by multiplying care seeking at each level by a metric from the 2016 Services Availability and Readiness Assessment that estimated overall diagnostic coverage at each sector and level. Columns 3 and 5 separate public and private sectors on the basis of each sector’s contribution to tuberculosis services access at initial care seeking. Column 4 shows the estimated percentage of health facilities that have tuberculosis treatment services at each sector and level of the health system [10]. Column 5 shows the estimated percentage of patients likely to access a facility with tuberculosis treatment provision services available on their initial visit to a healthcare facility (calculated by multiplying column 1 and column 4). Column 6 shows the location of treatment among participants in the 2011 prevalence survey who had previously received tuberculosis treatment [5], with the assumption that this metric provides the most representative picture of where patients are treated nationwide. Treatment received in the informal private sector (<1%) and at facilities categorized as “other” (<2%) are excluded from this column. Column 7 shows which sector provided case notification, and values are calculated as a share of the overall estimated incidence in 2015 [3]. Column 8 shows the treatment outcome of notified cases among the overall estimated incidence for 2015 [3]. Columns may not add to 100%, owing to rounding. For more details on data sources used in the pathway, see the Supplementary Materials. Abbreviation: NA, not available.

