Fig. 2.
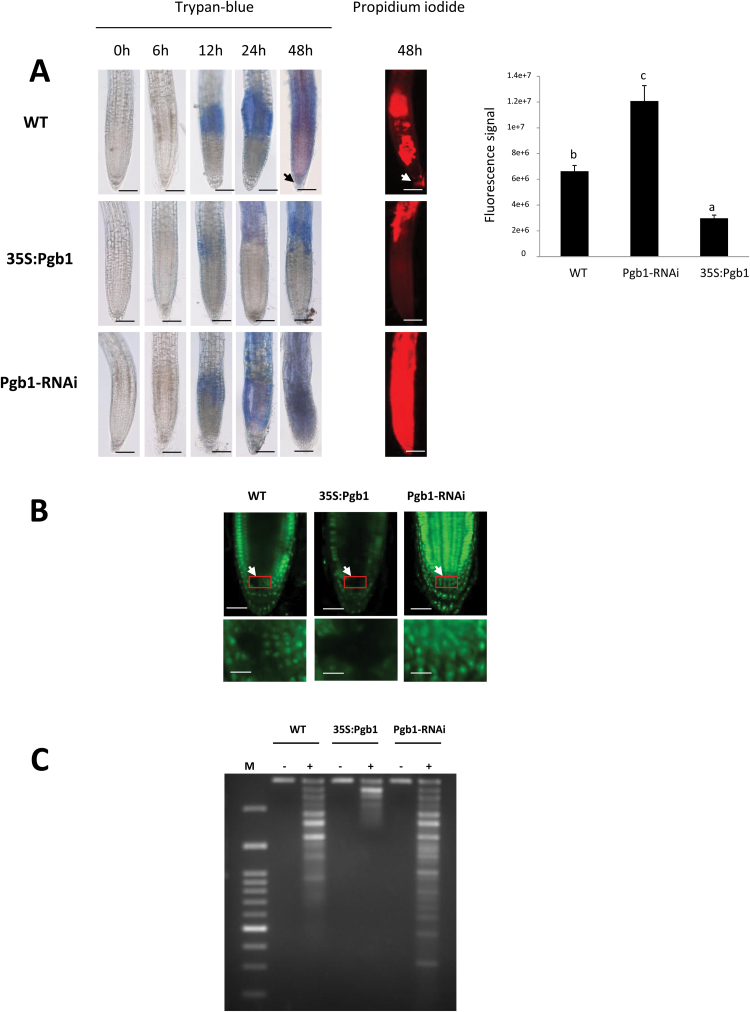
Programmed cell death (PCD) in roots exposed to 40% PEG (–1.76 MPa). (A) Trypan blue and propidium iodide staining of roots of the wild-type (WT) and lines overexpressing (35S:Pgb1) or down-regulating (Pgb1-RNAi) AtPgb1. Roots were grown on 40% PEG and stained at different time points (as indicated). The arrow indicates staining in the root tip of WT roots. The graph indicates the fluorescence signal (in pixels) of propidium iodide within the root apical tip (1 mm). Scale bars are 100 μm. Values are means ±SE of three biological replicates. Different letters on the graph indicate statistically significant differences (P<0.05). (B) Terminal deoxynucleotidyl transferase dUTP nick-and labelling (TUNEL) staining in the root tips after 48 h in 40% PEG. Arrows indicate the centre of the root apical meristem (RAM). The bottom panels are higher magnification images of the RAMs enclosed in the red boxes. Scale bars are 50 μm (upper panels) and 20 μm (lower panels). (C) Fragmentation of DNA extracted from roots of different lines grown for 48 h in the presence (+) or absence (–) of PEG. M, molecular weight marker.

