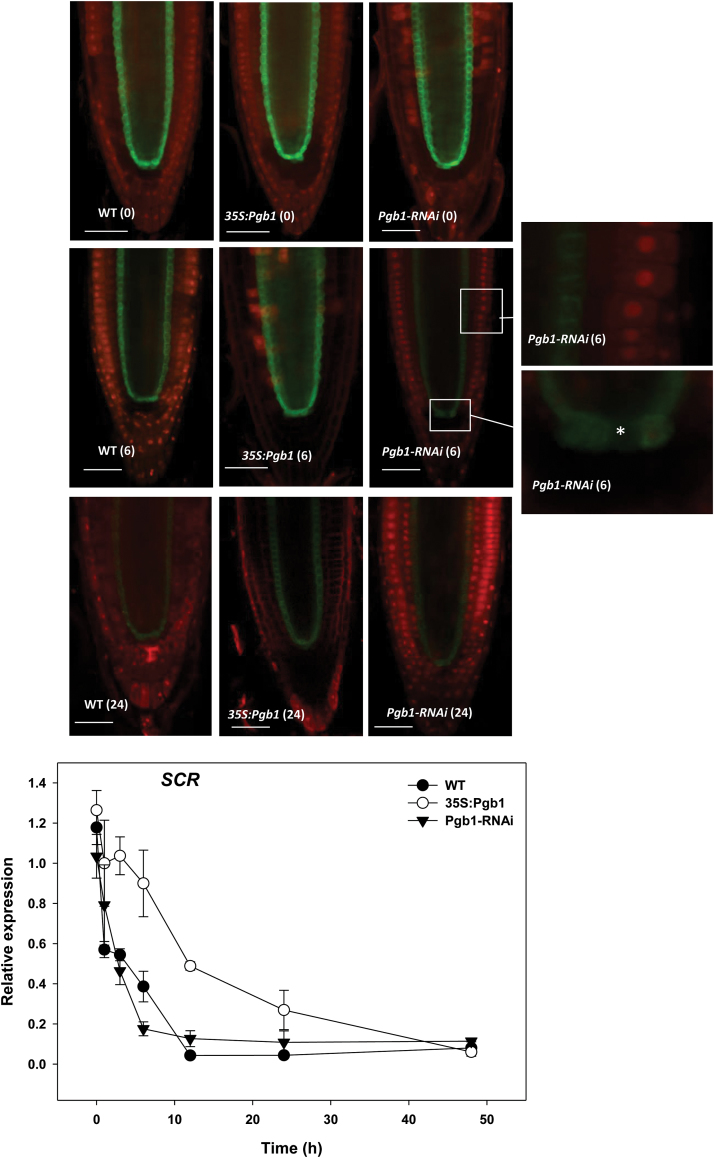
Fig. 7.
Localization and expression of SCARECROW (SCR) in the wild-type (WT) and lines overexpressing (35S:Pgb1) or down-regulating (Pgb1-RNAi) AtPgb1 grown for 48 h in the absence or presence of 40% PEG (–1.76M Pa). Numbers in brackets on the images indicate hours of treatment in PEG. Confocal images of SCR:GFP marking the endodermis and quiescent cells (QCs), and the relative abundance of SCR transcripts; * indicates quiescent cell. The expression values are normalized to the WT at 0 h (set at 1), and are means ±SE of three biological replicates. Scale bars are 50 μm.

