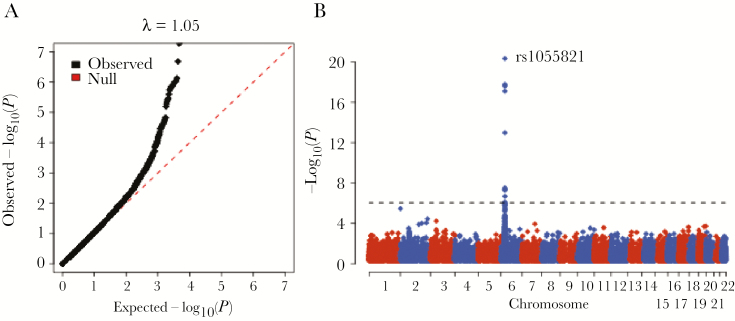
Figure 1.
Meta-analysis of association results with HIV load for 55714 variants. A, Quantile–quantile plot showing observed −log10(P) vs expected −log10(P) under the null hypothesis. The bulk of the observed P-value distribution (black diamonds) is in line with the null expectation (dashed red line) and the genomic inflation factor (median observed chi square statistics divided by expected) is approximately 1 (λ = 1.05). This suggests very little inflation in the test statistic dues to confounding factors. Axes are truncated at P <1 × 10⁻⁷. B, Manhattan plot. Per variant association P values (−log10 transformed) are plotted (y axis, colored diamonds) by chromosomal position (x axis). Only variants within the MHC region show significant associations after correcting for multiple testing (P <9 × 10⁻⁷, dashed line).

