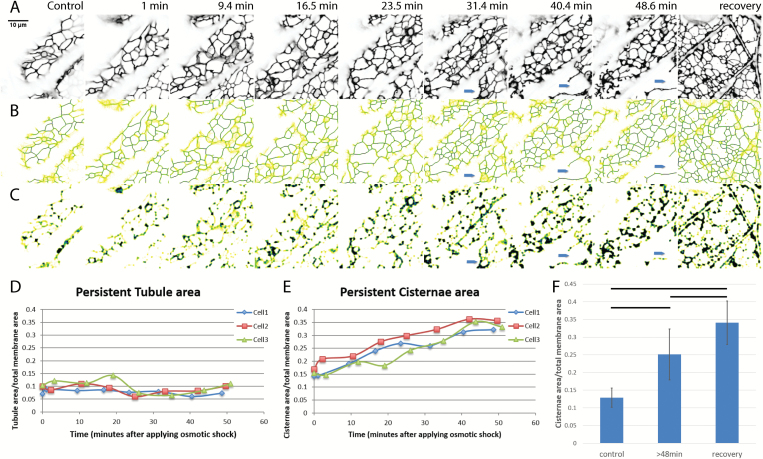
Fig. 1.
Change in amount of persistent ER cisternae and tubules after osmotic shock in N. benthamiana seedlings with ER lumen labeled with GFP-HDEL. A–C) Z-projections and persistency maps of time-lapse movies taken at different time points indicated by the numbers on each column showing the minutes after starting 0.75 M sorbitol treatment. Recovery is within 20 min of sorbitol wash out. Blue arrows indicate where the protoplast withdraws from the cell wall. Darker blue colors indicate the highest persistency, while yellow indicates the lowest persistency. Scale bar,10 μm. A) Projection of the sum of the movie frames showing the general structure of ER in black. B) Persistency map of ER tubules. C) Persistency map of ER cisternae. D) Tubule persistency in three different representative cells, indicated by different colors and symbols, over the times indicated after treatment with sorbitol. E) Cisternal persistency in the same three cells. F) Change in the persistent cisternal area over time as percentage of total membrane imaged. Three time points were chosen for comparison: control (before treatment), plasmolysis (after 48 min of treatment), and during recovery. Horizontal lines show significant differences with P<0.05. Bars show average values. Error bars are standard deviation, n=10 cells.

