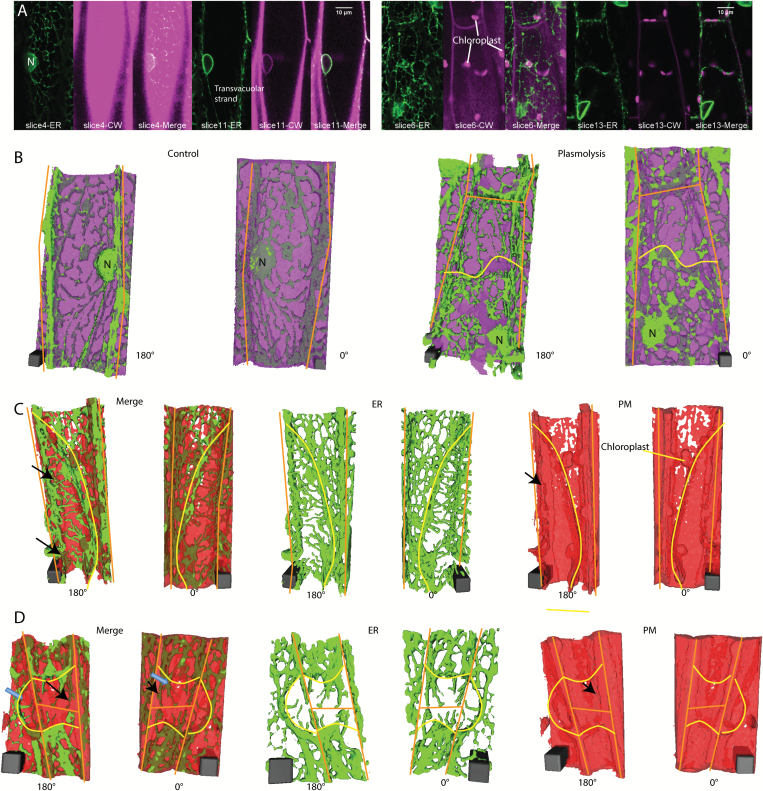
Fig. 3.
3D ER reconstructions in relation to the position of cell wall labeled with propidium iodide or plasma membrane labeled with FM4-64 in N. benthamiana hypocotyl cells expressing GFP-HDEL. A) Confocal images of ER (green) and cell wall labeled with propidium iodide (magenta) at two different focal planes in control (left panel) and plasmolyzed cells (right panel). B) 3D reconstructions of cells shown in (A). ER (green) and cell wall (magenta) in control (left 2 images) and plasmolyzed cells (right 2 images). Scale bar, 4μm*4μm*10.6μm for control, 4μm*4μm*14.31μm for plasmolysis. C) 3D reconstructions of a cell undergoing concave plasmolysis, showing the ER (green) and plasma membrane (red). Scale bar, 6μm*6μm*15.3μm. Black arrows indicate Hechtian strands surrounded by plasma membrane. D) 3D reconstructions of two cells undergoing convex plasmolysis and an adjacent cell undergoing concave plasmolysis, showing the ER (green) and plasma membrane (red). Black arrows indicate Hechtian reticulum with plasma membrane label on both the inside and outside. Adjacent cells often pull away in the same region but some show concave plasmolysis (blue arrow in 180° Merge) and others show convex plasmolysis (blue arrow in 0° Merge). Scale bar, 6μm*6μm*12μm. Yellow lines indicate withdrawing protoplast border, orange lines indicate cell wall border. CW, cell wall; PM, plasma membrane.

