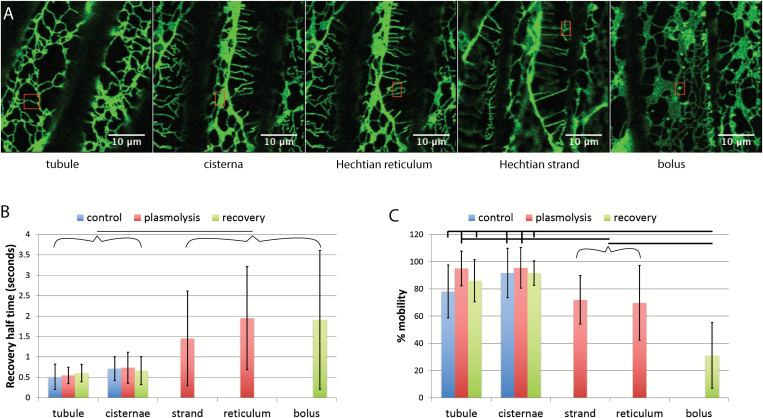
Fig. 5.
FRAP of different regions of the ER before and during plasmolysis and following recovery from plasmolysis in tobacco seedlings. A) Images showing representative regions being assessed by FRAP (red rectangles) Scale bar=10 μm. B) Recovery half-time of GFP-HDEL in tubules, cisternae, Hechtian strands and reticulum, and boluses that form upon deplasmolysis. Horizontal line between bracketed groups indicate a significant difference (P<0.05). n=18, 12, 13, 23, 9, 11, 24, 18, and 12 for each bar from left to right. C) Percentage mobility of the GFP-HDEL in tubules, cisternae, Hechtian strands and reticulum, and boluses that form upon deplasmolysis. Horizontal lines show significant differences between the indicated selected or bracketed groups (P<0.05, except for Hechtian strands and plasmolysis cisternae where P=0.0507). n=18, 12, 13, 23, 9, 11, 24, 18, and 13 for each bar from left to right. Bars are average values. Error bars represent standard deviation.

