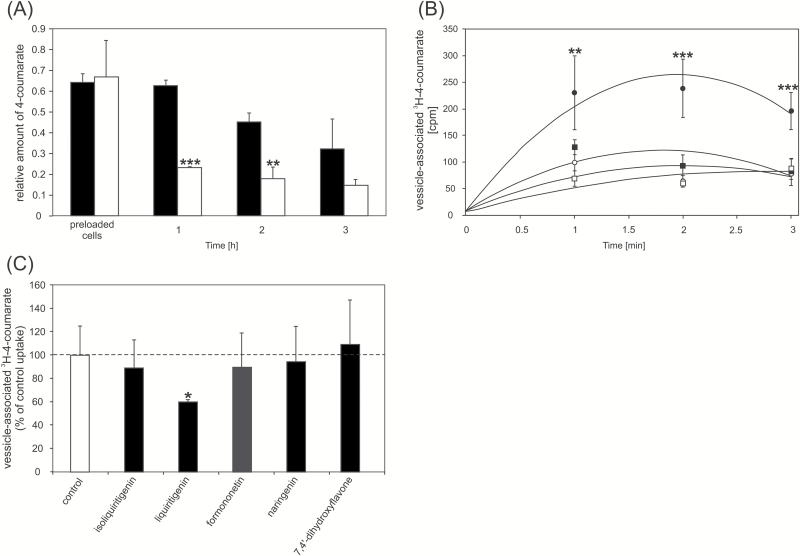
Fig. 5.
4-Coumarate transport assays in BY2 cells and cell-derived vesicles. (A) The 4-coumarate efflux from BY2 control (black bars) and MtABCG10-overexpressing (white bars) cell lines monitored by HPLC/MS. The relative amounts of the metabolite are presented as the ratio of the single-ion chromatogram peak area of the metabolite and the internal standard. The values represent the mean of three independent experiments ± SD. Significant differences between control and overexpressing lines determined by Student’s t-test are indicated: **P < 0.01; ***P < 0.005. (B) Transport of 3H-4-coumarate into membrane vesicles derived from BY2 cells overexpressing MtABCG10 in the presence (closed circles) or absence (open circles) of ATP, and BY2 control cells in the presence (closed squares) or absence (open squares) of ATP. The values represent the mean of three independent experiments ± SD. The significant differences between MtABCG10-overexpressing lines in the presence of ATP (closed circles) in comparison to other lines/conditions determined by an ANOVA test and Tukey’s Multiple Comparison test are as follows: **P < 0.01; ***P < 0.005. (C) Competition between 3H-4-coumarate and selected phenolic compounds for transport into membrane vesicles derived from BY2 cells overexpressing MtABCG10. The competing substrates isoliquiritigenin, liquiritigenin, formononetin, naringenin, and 7,4’-dihydroxyflavone were used at a 10 µM concentration. The values represent the mean of six replications ± SD. The line at 100% corresponds to the vesicle-associated radioactivity 3 min after the addition of 3H-4-coumarate to the membrane vesicles. Significant differences between control and supplemented samples determined by Student’s t-test are indicated: *P < 0.05.

