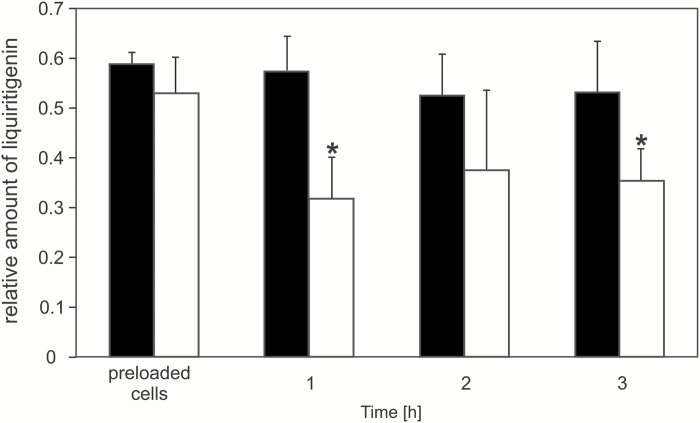
Fig. 6.
The liquiritigenin efflux from BY2 control (black bars) and MtABCG10-overexpressing (white bars) cell lines, monitored by HPLC/MS. The relative amounts of the liquiritigenin are presented as the ratio of the single-ion chromatogram peak area of the metabolite and the internal standard. The values represent the mean of two independent experiments ± SD. Significant differences between control and overexpressing lines determined by Student’s t-test are indicated: *P < 0.05.

