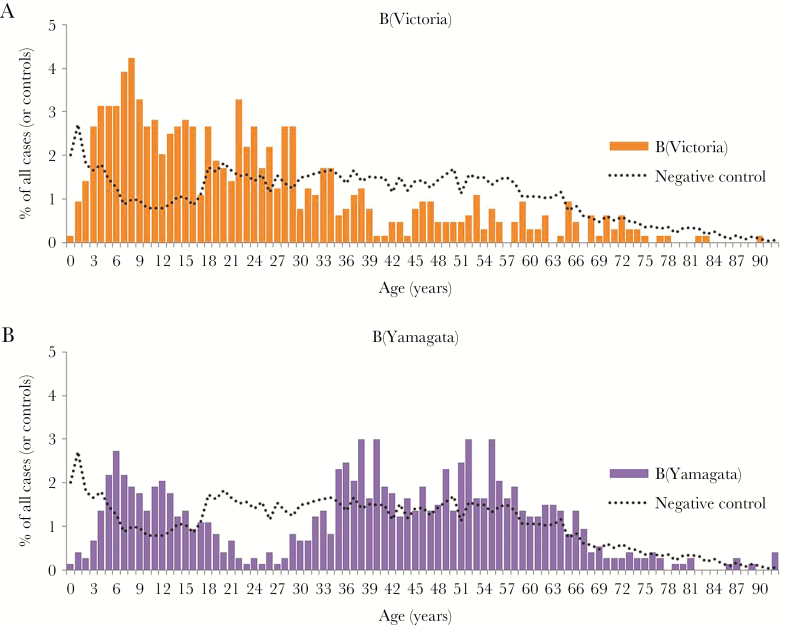
Figure 2.
Percentage distribution of influenza B(Victoria) cases (A) and influenza B(Yamagata) cases (B) and test-negative controls by single-year age group, Canadian Sentinel Practitioner Surveillance Network (SPSN), 2010–2011 to 2015–2016. The percentage of all cases of the specified influenza B lineage belonging to a given age (in years) is displayed as a bar graph; the same information for test-negative controls is superimposed as a dotted line for comparison purposes to indicate the sampling distribution by age in the overall SPSN sample.

