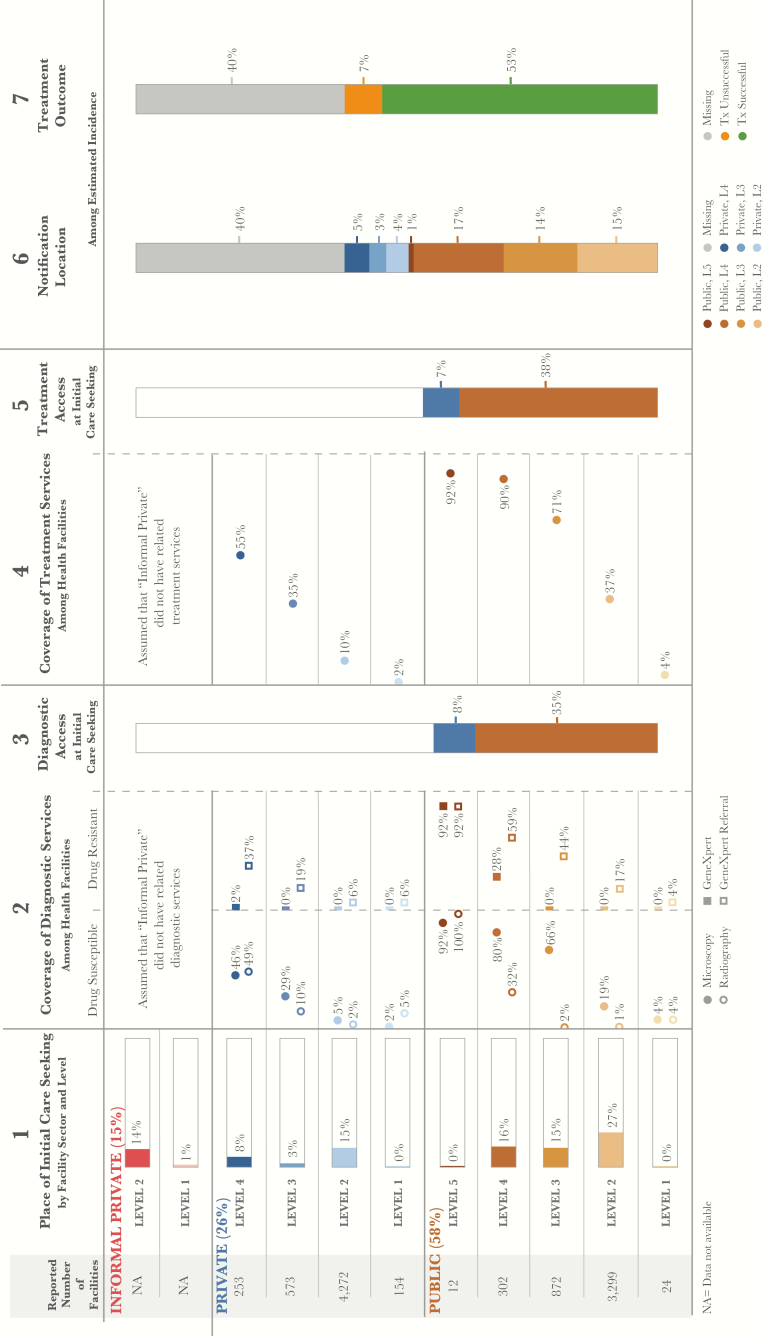
Figure 1.
Patient-pathway visual at the national level. The patient pathway describes the care-seeking patterns of patients and how those patients may intersect with tuberculosis services. Column 1 identifies the sectors and levels of the health system, followed by the estimated number of health facilities at each sector and level, according to the 2016 Kenya Master Health Facility List (FML) for Kenya [12]. The percentage next to each sector title is the share of patients who initiate care seeking in this sector. The final part of column 1 shows the percentage of patients seeking care at each sector and level among participants in the 2013 Kenya Household Health Expenditure and Utilization Survey (KHHEUS) who sought care for tuberculosis and/or respiratory illness in the 4 weeks preceding the survey [15]. Three of Kenya’s 47 counties—Garissa, Mandera, and Wajir—were excluded from the KHHEUS and are not reflected in the national pathway. Column 2 shows the percentage of health facilities that have tuberculosis diagnostic tools across each sector and level of the health system. Data on radiography coverage are from 2013 Kenya Service Availability and Readiness Assessment Mapping (SARAM) records [17]. Smear microscopy coverage reflects National Tuberculosis, Leprosy, and Lung Disease Program laboratory records [17]. GeneXpert system and GeneXpert referral coverage reflect national GeneXpert test records (19). Diagnostic tools are separated by tools for diagnosing drug-susceptible tuberculosis and those for diagnosing drug-resistant tuberculosis. Column 3 shows the estimated percentage of patients likely to access a facility with a tuberculosis diagnostic tool on their initial visit to a health care facility, per the care-seeking patterns reflected in the KHHEUS. Data in column 3 were calculated in 2 stages. First, where possible (for 27% of KHHEUS care seekers), the facilities reportedly visited were matched by name to facilities from the FML, and the proportion of care seekers who accessed a facility with any tuberculosis diagnostic tool at initial care-seeking was calculated. Second, for the remainder of care seekers whose place of initial care seeking was not matched by name to the FML, access to diagnosis was estimated on the basis of diagnostic services coverage (columns 2a and 2b) at the health sector and level where they reportedly sought care. By multiplying the proportion of care seekers at each level by the diagnostic coverage at that level (among facilities that were not matched to care seekers in the first stage), the percentage of care seekers who accessed a facility with any diagnostic tool at the initial point of care seeking was estimated. Column 3 reflects the sum of stages 1 and 2—the total proportion of care seekers estimated to have accessed any diagnostic tool at initial care seeking. Columns 3 and 5 separate public and private sectors on the basis of each sector’s contribution to tuberculosis services access at initial care seeking. Column 4 shows the percentage of health facilities that have tuberculosis treatment, reflecting the availability of any tuberculosis drugs when the 2013 SARAM data were collected. Column 5 shows the estimated percentage of patients likely to access tuberculosis treatment at initial care seeking, per KHHEUS care-seeking patterns. Column 5 was calculated in 2 stages in the same manner as in column 3. Column 6 shows which sectors and levels provided case notification, and data were calculated as a share of the overall estimated incidence in 2015. Column 7 shows the treatment outcome of notified cases among the overall estimated incidence for 2015. Data on notification source and treatment outcomes reflect NTLP records [8]. Columns may not add to 100%, owing to rounding. For more details on the data sources used in the pathway, see the Supplementary Materials.

