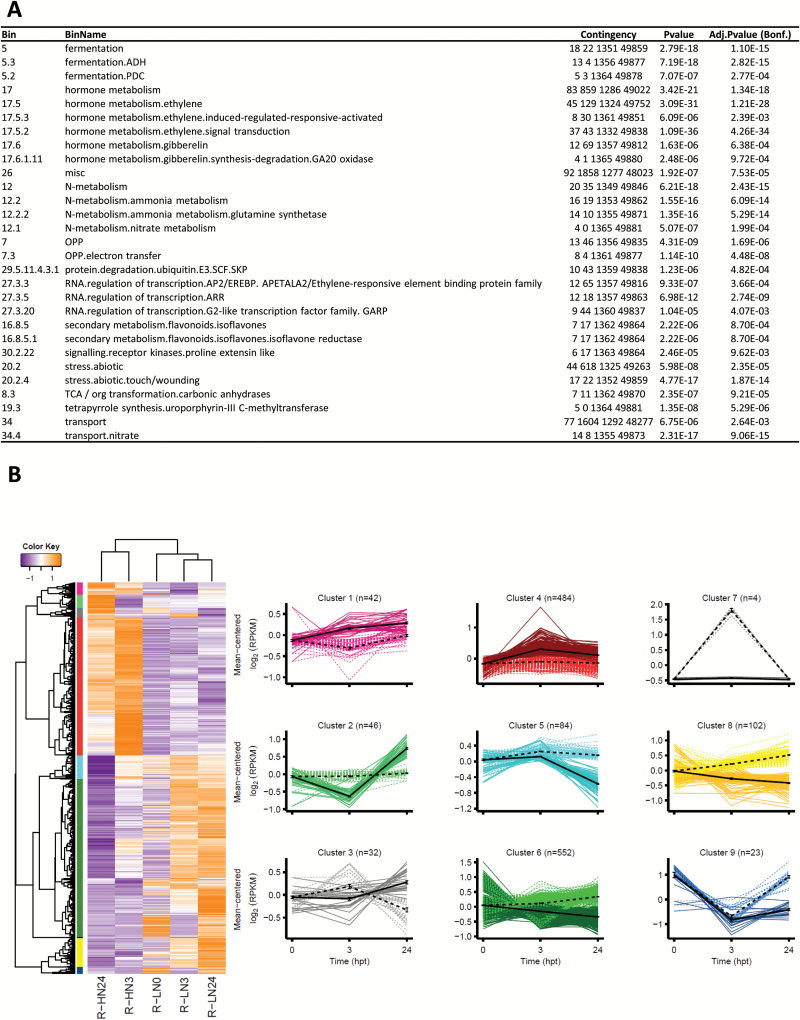
Fig. 6.
In response to higher N availability, six-fold more genes were differentially expressed in CS/RGM compared with CS/1103P. (A) Enrichment analysis of the DEGs from CS/RGM (n=1369). The Contingency column shows the number of genes (i) in the BIN in the input list, (ii) in the background, (iii) not in the BIN in the input list, and (iv) not in the background. P-values were adjusted with a Bonferroni correction. Values were filtered with an adjusted P-value threshold <0.01 and an enrichment >1. (B) Hierarchical clustering of the transcripts and the different conditions (i.e. treatment × harvesting time) in a heatmap presenting the expression pattern of each DEG (rows) within the different samples (columns). The harvesting time 0 hpt was excluded during the hierarchical clustering process. Expression values are RPKM log2-transformed with up-regulation to down-regulation varying from orange to purple. Right panel, transcript clusters were extracted using the gene hierarchical clustering tree. The x-axis of each plot represents the harvesting time (in hpt); the y-axis represents the mean-centred RPKM log2-transformed values. The HN condition is indicated by dark-coloured solid lines and the LN condition by light-coloured dashed lines. Mean±SE values are represented in black.

