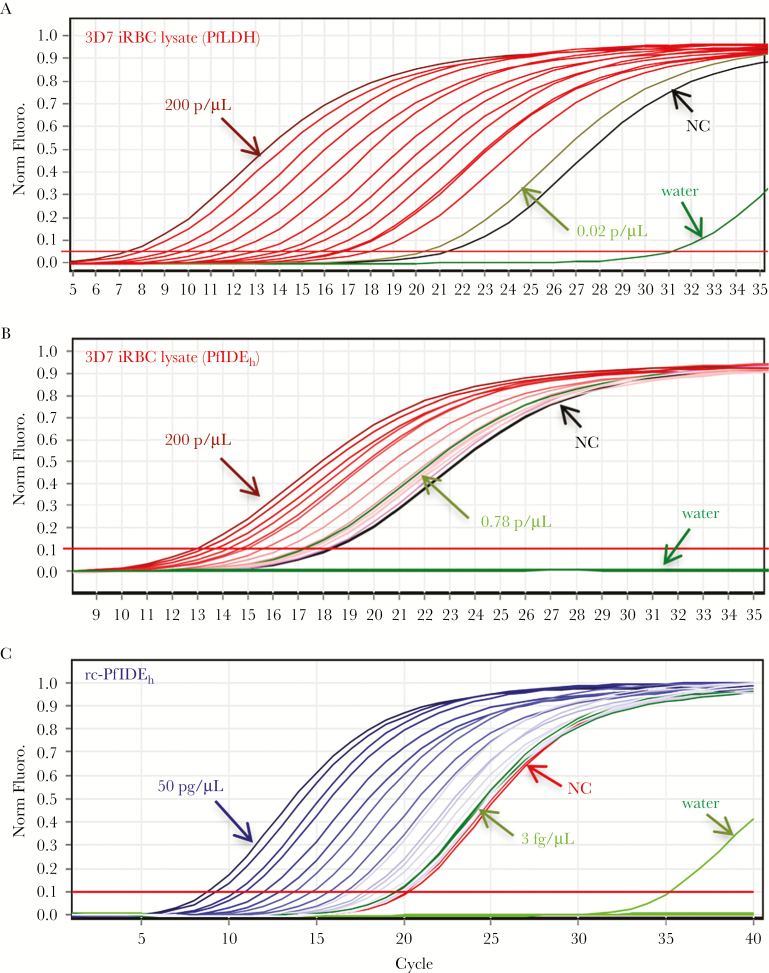
Figure 3.
Immuno–polymerase chain reaction (i-PCR) detection of Plasmodium falciparum lactate dehydrogenase (PfLDH) and P. falciparum insulin-degrading enzyme homolog (PfIDEh) antigens. A, i-PCR curves of PfLDH in 2-fold serially diluted lysates from a culture of P. falciparum 3D7. MBS498007 was employed as the capture antibody and streptavidin-conjugated MBS498008 was used for i-PCR detection of PfLDH. Signal levels were proportional to the lysate dilution. Results from negative controls (NC; no added biotinylated DNA) and no lysate (water only) are shown in black and dark green, respectively. Final PCR products were run on 2% agarose gel to confirm the specific amplification of targeted region (161 bp). Late signals in water control samples (dark green) were from primer dimers, also confirmed by gel electrophoresis. Light-green curve shows the delta cycle threshold (∆Ct) of the tested sample concentration (0.02 parasite/μL) closest to the limit of detection (LOD), calculated as the value of the NC plus 3 standard deviations (SD). B, i-PCR curves of PfIDEh in 2-fold serially diluted lysates from a culture of P. falciparum 3D7. Mouse monoclonal antibody (mAb) 3B4D12 was employed as the capture antibody and streptavidin-conjugated rabbit mAb AID-1-1-9 was used for detection of PfIDEh. Signal levels were proportional to the lysate dilution. Results from negative controls of no added biotinylated DNA and no lysate (water only) are shown in black and dark green, respectively. Light-green curve shows the ∆Ct of the tested sample concentration (0.78 parasite/μL) closest to the LOD, which is calculated as the value of the NC plus 3 SD and is limited by the background signal from NC. C, i-PCR curves of 2-fold serially diluted recombinant PfIDEh (rc-PfIDEh) protein captured by 3B4D12 and detected by AID-1-1-9. Results from negative controls of no added biotinylated DNA and no lysate (water only) are shown in black and dark green, respectively. Light-green curve shows the ∆Ct of the tested rc-PfIDEh concentration (3 fg/μL) closest to the LOD, calculated as the value of the NC plus 3 SD. All experiments were performed in duplicate. Abbreviations: iRBC, infected red blood cell; Norm. Fluoro., normalized fluorescence.

