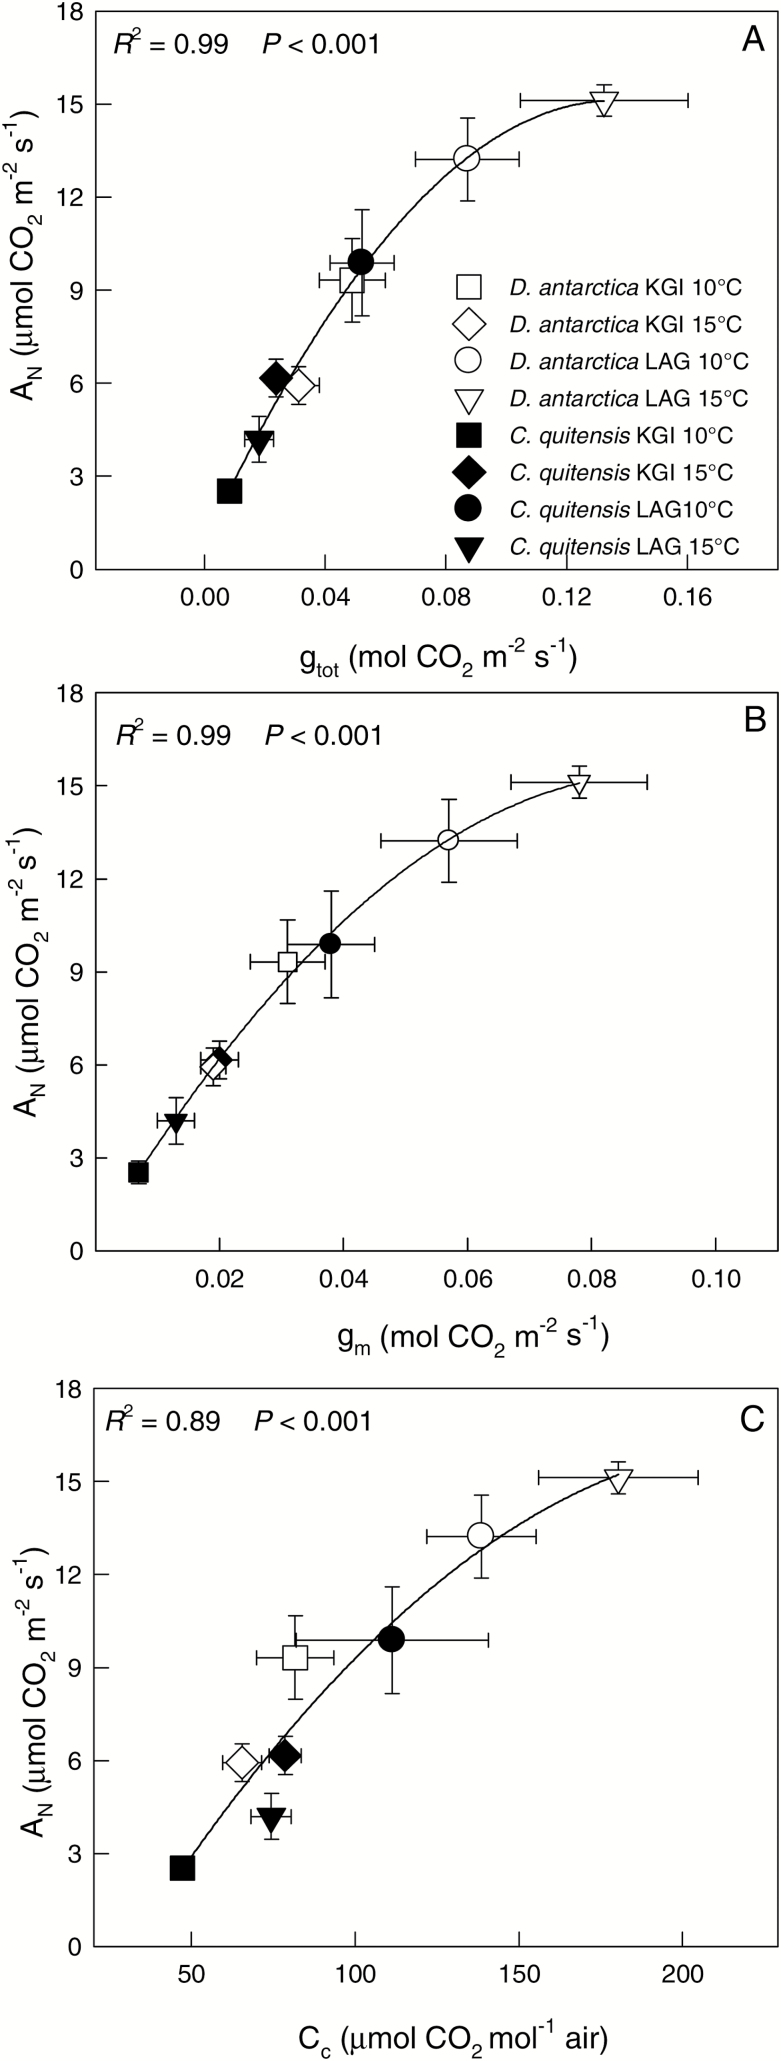
Fig. 5.
The relationship of (A) the total leaf conductance (gtot), (B) the leaf mesophyll conductance (gm), and (C) the chloroplast CO2 concentration (Cc) to the net photosynthetic CO2 assimilation rate (AN) of D. antarctica (open circles) and C. quitensis (filled circles) in King George (KGI) and Lagotellerie Island (LAG). Goodness of fit with a saturation model is shown for both species and considering all populations and measurement temperatures together. Values are means ± SE (n=5–7).

