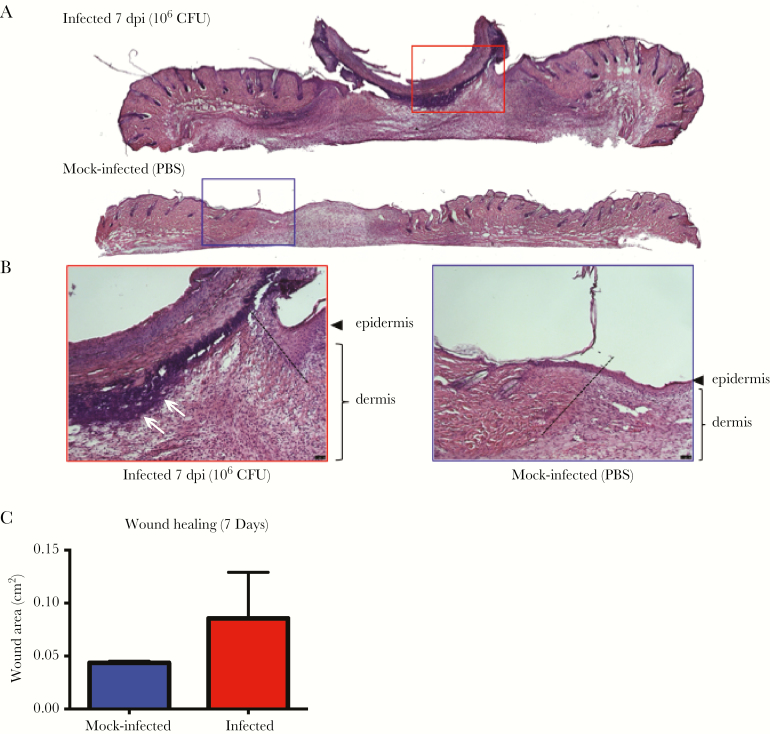
Figure 6.
Enterococcus faecalis infection alters wound healing dynamics. Wounds were harvested at 7 days postinfection (dpi) and subjected to H&E staining. A,B, Red and blue boxes represent the wound edge for the infected wounds and mock-infected controls, respectively. B, Higher magnification images of the boxes depicted in (A) and dashed line indicate the wound edge. Clusters of polymorphonuclear leukocytes are present at the 7 dpi wound (white arrows) but absent from the mock-infected wound. Bar represents 20 μm. Images are representative observations from 3 independent samples examined. C, Wound area at 7 dpi. Blue and red bar graphs represent the mean area of the mock infected and infected wounds respectively. Error bars represent the standard deviation. Measurements were made from 4 independent mice from each group.

