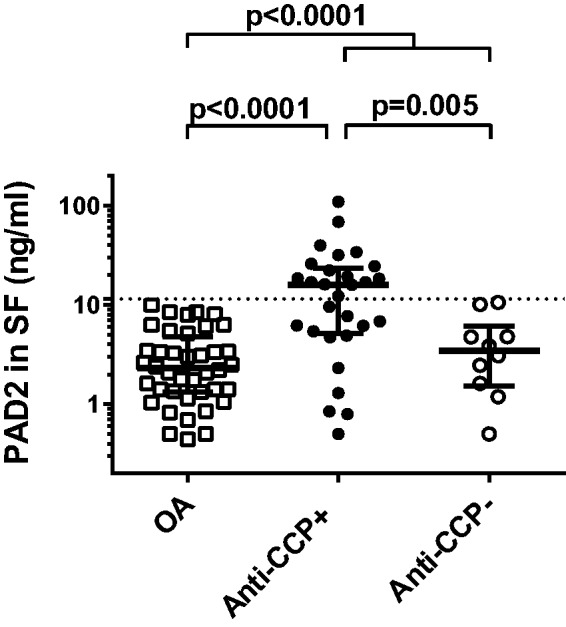
Fig. 1.

PAD2 concentration in SF
The concentration of PAD2 in SF from 40 patients with OA, 29 anti-CCP-positive RA patients and 10 anti-CCP-negative RA patients was measured by ELISA. Medians and interquartile ranges are shown. The dotted line represents a cut-off value of 11.45 ng/ml, determined by ROC analysis.
