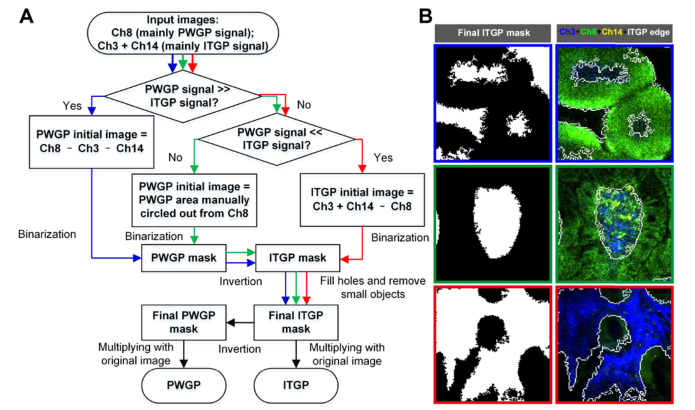
Fig. 2.
Image segmentation algorithm for separating PWGP and ITGP. (A) Algorithm flow chart. (B) The final segmentation results of exemplar images (left column) and the pseudo-color merged images of raw Ch3, Ch8, and Ch14 images as well as the ITGP edges (right column). The blue, green, and red border images are processed through the blue, green, and red paths in the flowchart, respectively.

