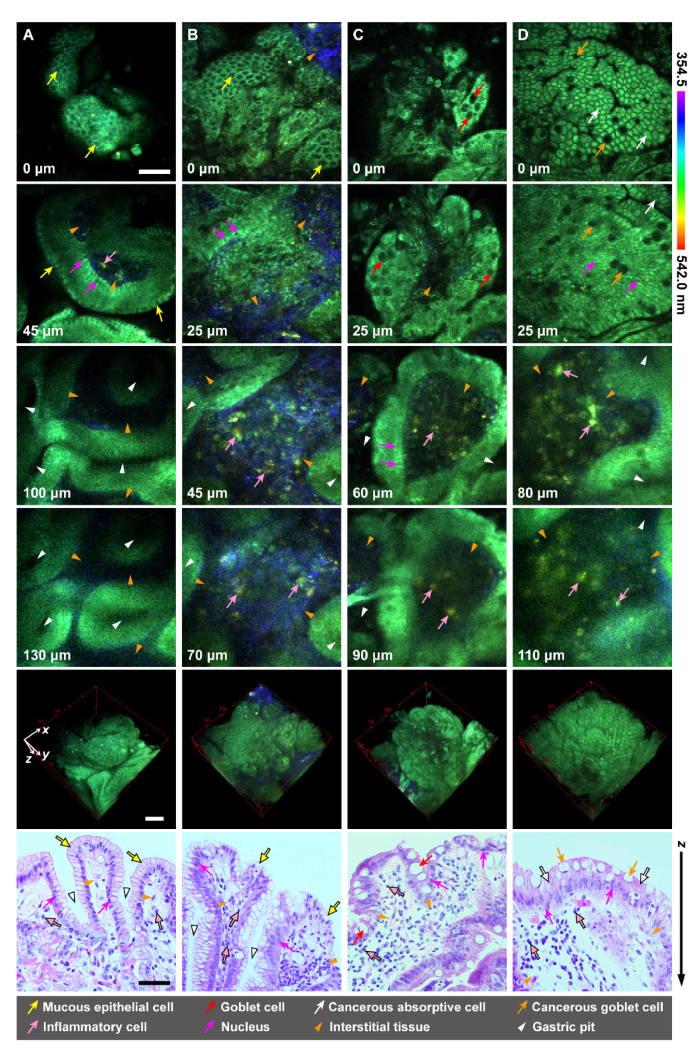
Fig. 4.
Spectrum-coded 3D structures and corresponding histology of the normal and diseased human gastric antrum mucosa: (A) normal; (B) chronic gastritis with erosion; (C) chronic gastritis with intestinal metaplasia; (D) intestinal-type adenocarcinoma. The spectrum-coded images with different depths (transverse view) and corresponding 3D images are shown in the first four rows and the fifth row, respectively. The depth is labeled in the bottom left corner of each panel. The H&E stained histology images (longitudinal view) are displayed in the last row. Scale bars are 50 μm.

