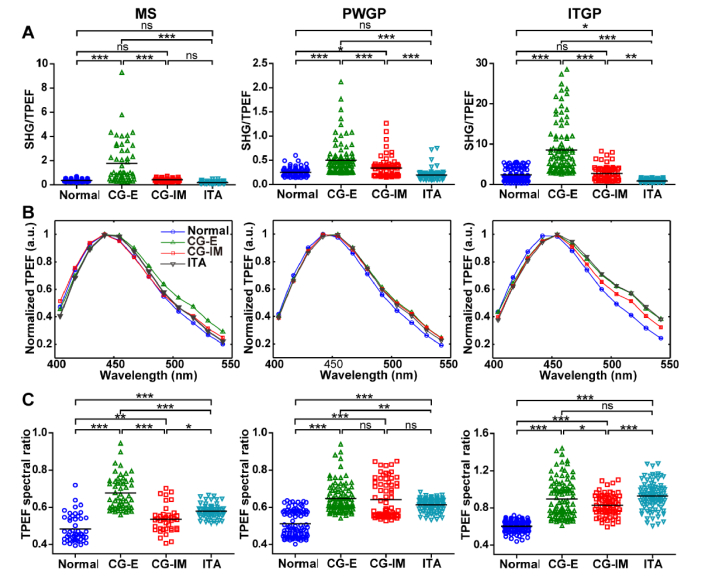
Fig. 6.
Spectral characteristics of the multiple components of the normal and diseased human gastric antrum mucosa: comparison of normal tissue and diseased tissues of chronic gastritis with erosion (CG-E), chronic gastritis with intestinal metaplasia (CG-IM), and intestinal-type adenocarcinoma (ITA). (A) The ratio of SHG signal to TPEF. (B) The spectra of TPEF. The error bars denote the SEM. (C) The ratio of TPEF with long wavelength (517 ± 6.25 nm) to that with short wavelength (417 ± 6.25 nm). The black solid lines in (A) and (C) indicate the mean values. ns: no significant difference; *: 0.01 <P < 0.05; **: 0.001 <P < 0.01; ***: P < 0.001, one-way ANOVA and Tukey’s multiple comparison test.

