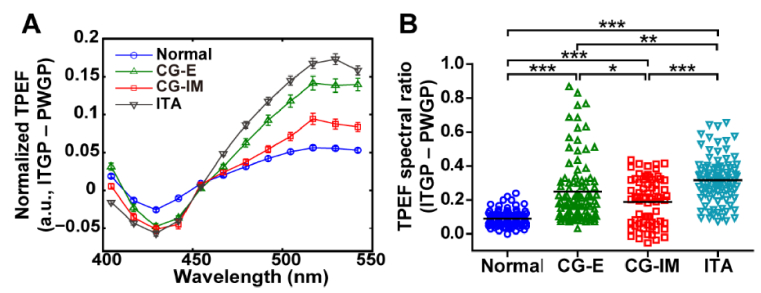
Fig. 7.
The differences of TPEF spectral parameters between interstitial tissue between gastric pits (ITGP) and peripheral wall of gastric pits (PWGP). (A) The TPEF spectral difference. The error bars denote the SEM. (B) The difference of TPEF spectral ratio. The TPEF spectral ratio was computed by dividing TPEF with long wavelength (517 ± 6.25 nm) by that with short wavelength (417 ± 6.25 nm)). The black solid lines indicate the mean values. *: 0.01 <P < 0.05; **: 0.001 <P < 0.01; ***: P < 0.001, one-way ANOVA and Tukey’s multiple comparison test.

