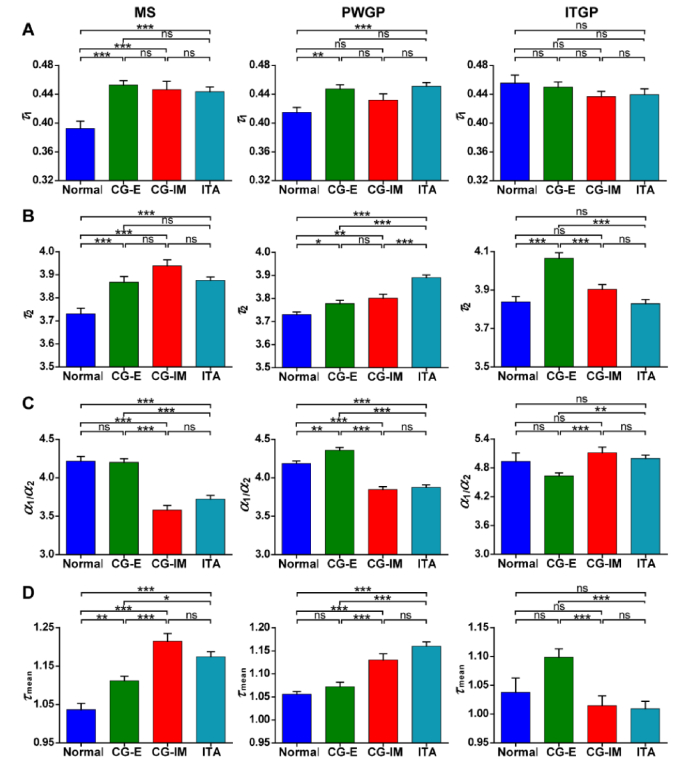
Fig. 10.
NADH fluorescence lifetime characteristics of the multiple components of the normal and diseased human gastric antrum mucosa: comparison of normal tissue and diseased tissues of chronic gastritis with erosion (CG-E), chronic gastritis with intestinal metaplasia (CG-IM), and intestinal-type adenocarcinoma (ITA). (A) The fluorescence lifetime of free NADH: τ1. (B) The fluorescence lifetime of protein-bound NADH: τ2. (C) The ratio of the amplitude coefficient of free NADH to that of protein-bound NADH: α1/α2. (D) The mean fluorescence lifetime: τmean. The error bars denote the SEM. ns: no significant difference; *: 0.01 <P < 0.05; **: 0.001 <P < 0.01; ***: P < 0.001, one-way ANOVA and Tukey’s multiple comparison test.

