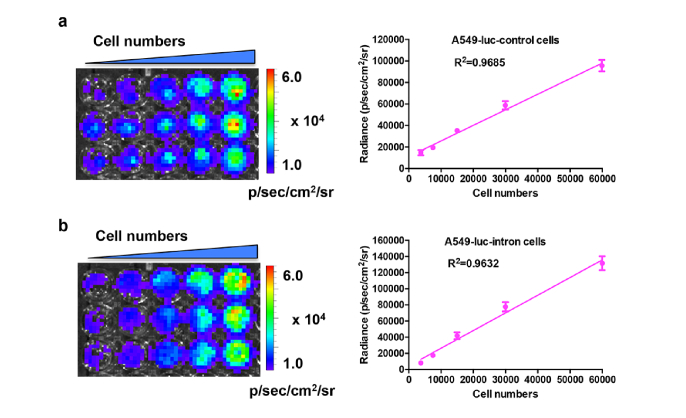
Fig. 2.
Correlation between bioluminescence signal and cell numbers in cells. The A549-luc-control cells (a) or A549-luc-intron cells (b) were seeded with different cell numbers in a 24-well plate. Then the in vitro bioluminescence imaging was performed following the addition of D-luciferin (150 μg/ml) substrate to the cells. The correlation curves were plotted for each cell line and the square of the correlation coefficients were 0.9685 and 0.9632, respectively.

