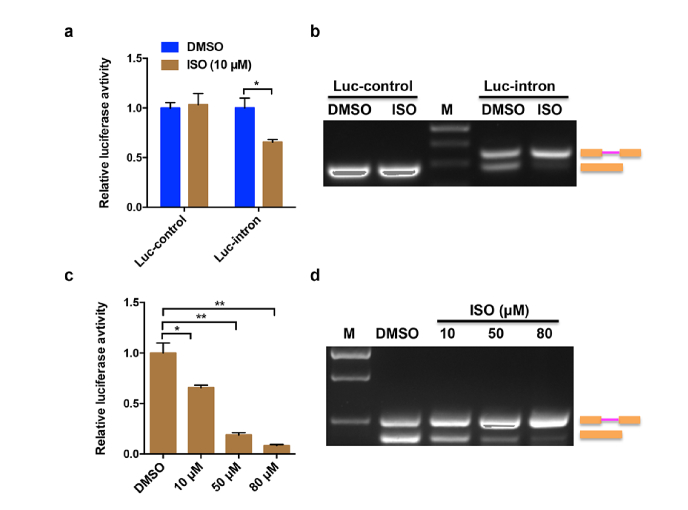
Fig. 3.
Measuring of splicing activity at different doses of ISO treatment. (a) The A549-luc-control cells or A549-luc-intron cells were treated with ISO (10 μM) or DMSO for 24 h. Then the luciferase activities were measured. (b) RT-PCR analysis of total RNA isolated from the cells treated with the same method described in (a). Sizes of unspliced and spliced products were indicated. (c) The A549-luc-intron cells were treated with DMSO or different doses of ISO (10, 50, 80 μM) for 24 h. Then the luciferase activities were measured. (d) RT-PCR analysis of total RNA isolated from the cells treated with the different doses of ISO used in (c). Error bars represent the standard deviations for three independent experiments. *p < 0.05, **p < 0.01.

