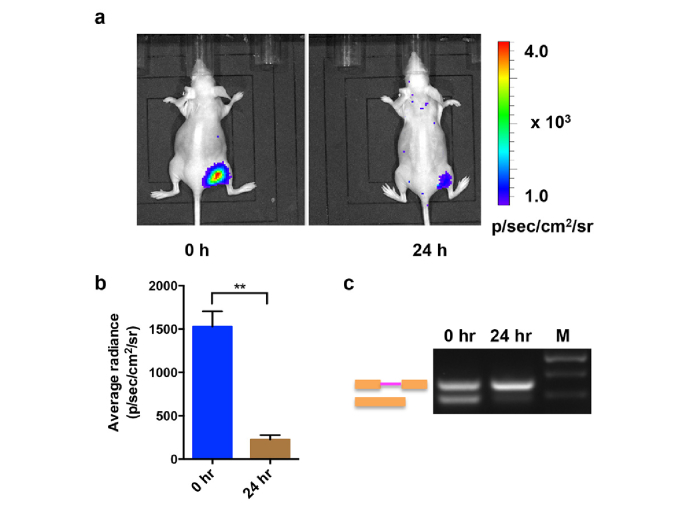
Fig. 6.
In vivo imaging of splicing by ISO. (a) The xenograft mice were intraperitoneally injected with 15 mg/kg ISO. The bioluminescence imaging was performed at the 0 h time point and 24 h time point after ISO treatment. A representative image was shown. (b) The quantification of the bioluminescence signal from the region of interest in mice treated by ISO at 0 or 24 h as described in (a). (c) RT-PCR analysis of total RNA isolated from tumors of the xenograft mice receiving ISO treatment at 0 h and 24 h time point.

